| Map | Pie | Year | Total | D | R | I | Margin | %Margin | Dem | Rep | Ind | Oth. | Dem | Rep | Ind | Other | | | | | | | | | | | | | | | | | | |
|---|
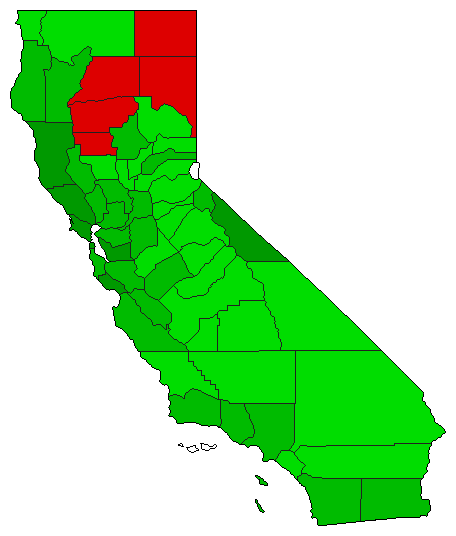 |  | 2022 |
10,752,580 |
2 |
0 |
1 |
3,096,646 |
28.80% |
35.60% |
0.00% |
64.40% |
0.00% |
3,827,967 |
0 |
6,924,613 |
0 |
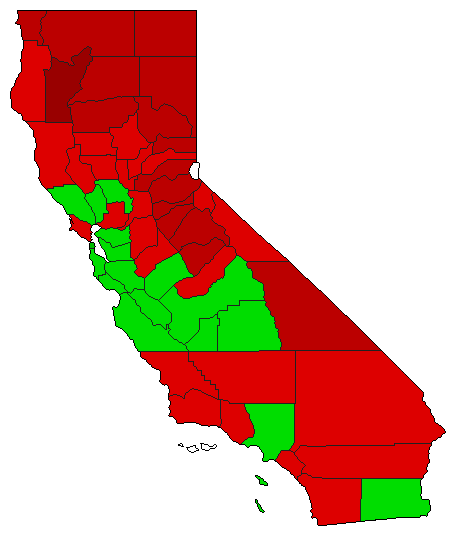 |  | 2018 |
11,914,827 |
1 |
0 |
2 |
155,155 |
1.30% |
50.65% |
0.00% |
49.35% |
0.00% |
6,034,991 |
0 |
5,879,836 |
0 |
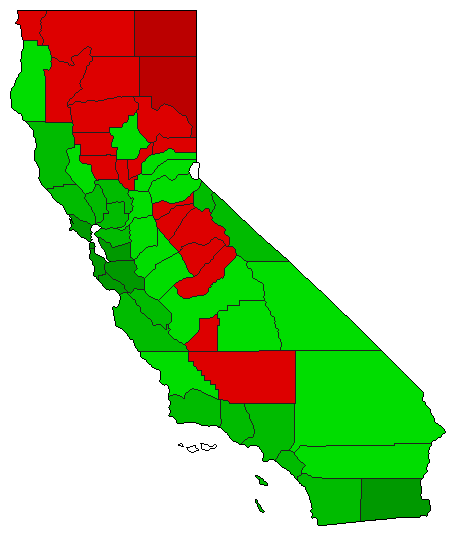 |  | 2016 |
13,938,442 |
2 |
0 |
1 |
4,022,454 |
28.86% |
35.57% |
0.00% |
64.43% |
0.00% |
4,957,994 |
0 |
8,980,448 |
0 |
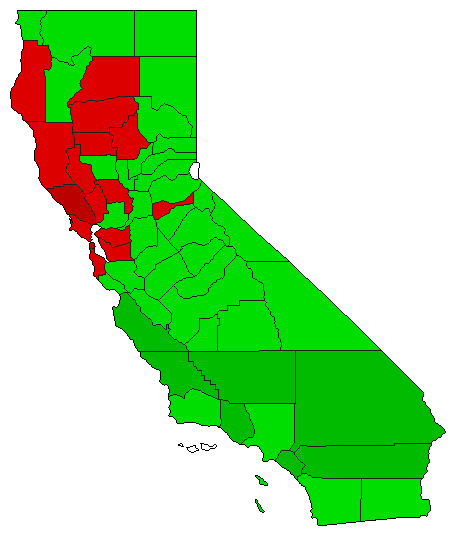 | | 2008 |
6,890,759 |
2 |
0 |
1 |
797,063 |
11.57% |
44.22% |
0.00% |
55.78% |
0.00% |
3,046,848 |
0 |
3,843,911 |
0 |
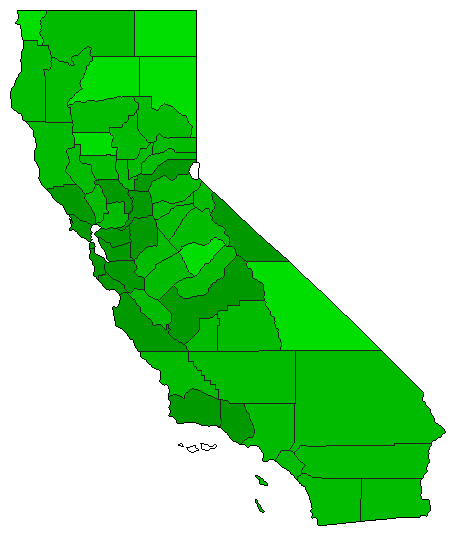
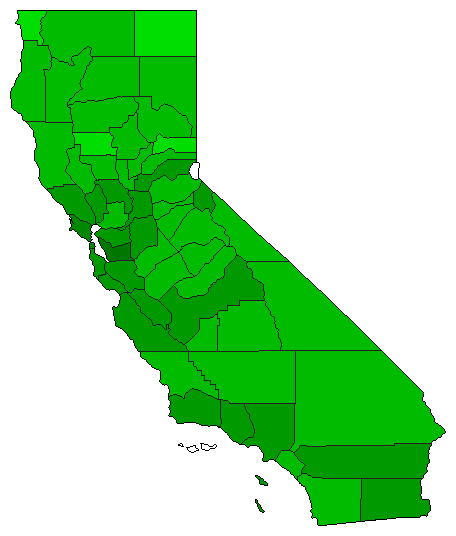 | | 2002 |
4,999,317 |
2 |
0 |
1 |
2,257,947 |
45.17% |
27.42% |
0.00% |
72.58% |
0.00% |
1,370,685 |
0 |
3,628,632 |
0 |
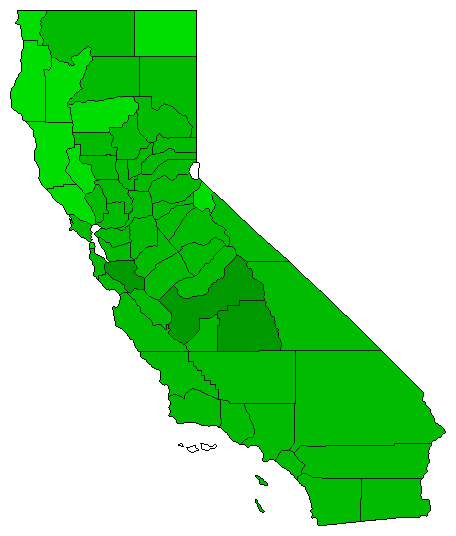
 | | 1998 |
6,069,187 |
2 |
0 |
1 |
2,338,347 |
38.53% |
30.74% |
0.00% |
69.26% |
0.00% |
1,865,420 |
0 |
4,203,767 |
0 |
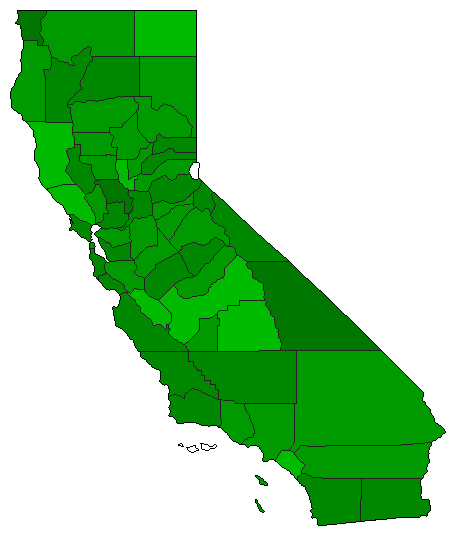
 | | 1990 |
4,816,025 |
2 |
0 |
1 |
1,546,151 |
32.10% |
33.95% |
0.00% |
66.05% |
0.00% |
1,634,937 |
0 |
3,181,088 |
0 |
 |  | 1916 |
636,061 |
2 |
0 |
1 |
330,241 |
51.92% |
24.04% |
0.00% |
75.96% |
0.00% |
152,910 |
0 |
483,151 |
0 |
|


