| Map | Pie | Office | Total | D | R | I | Margin | %Margin | Dem | Rep | Ind | Oth. | Dem | Rep | Ind | Other | | | | | | | | | | | | | | | | | | |
|---|
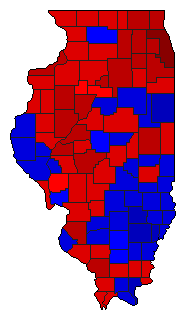
 |  | Governor |
4,559,563 |
1 |
2 |
0 |
713,995 |
15.66% |
54.39% |
38.73% |
0.00% |
6.89% |
2,479,746 |
1,765,751 |
0 |
314,066 |
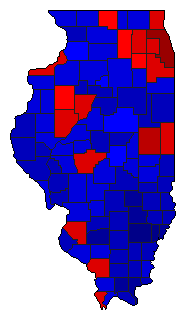
 |  | Secretary of State |
4,568,746 |
1 |
2 |
0 |
1,783,710 |
39.04% |
68.27% |
29.23% |
0.00% |
2.51% |
3,118,986 |
1,335,276 |
0 |
114,484 |
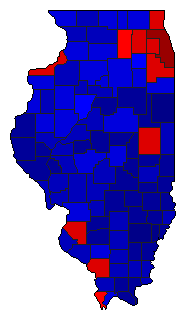
 |  | State Treasurer |
4,497,786 |
1 |
2 |
0 |
843,046 |
18.74% |
57.65% |
38.90% |
0.00% |
3.45% |
2,592,831 |
1,749,785 |
0 |
155,170 |
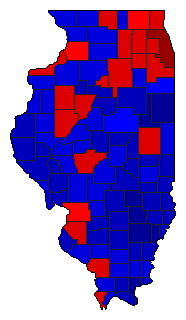
 |  | Attorney General |
4,546,371 |
1 |
2 |
0 |
544,428 |
11.98% |
54.71% |
42.74% |
0.00% |
2.55% |
2,487,457 |
1,943,029 |
0 |
115,885 |
 |  | Comptroller General |
4,533,671 |
1 |
2 |
0 |
1,038,429 |
22.90% |
59.90% |
37.00% |
0.00% |
3.10% |
2,715,812 |
1,677,383 |
0 |
140,476 |
|
