| Map | Pie | Office | Total | D | R | I | Margin | %Margin | Dem | Rep | Ind | Oth. | Dem | Rep | Ind | Other | | | | | | | | | | | | | | | | | | |
|---|
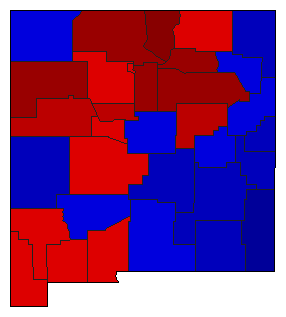
 |  | Senator |
697,012 |
1 |
2 |
0 |
164,185 |
23.56% |
54.09% |
30.53% |
0.00% |
15.38% |
376,998 |
212,813 |
0 |
107,201 |
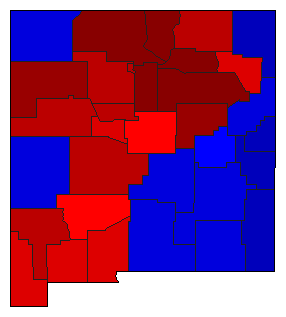
 |  | Governor |
696,459 |
1 |
2 |
0 |
100,277 |
14.40% |
57.20% |
42.80% |
0.00% |
0.00% |
398,368 |
298,091 |
0 |
0 |
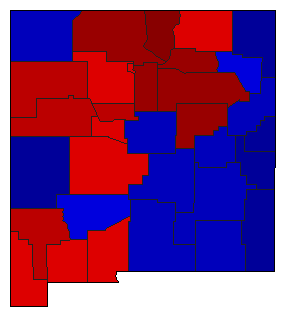
 |  | Secretary of State |
690,967 |
1 |
2 |
0 |
141,828 |
20.53% |
57.76% |
37.24% |
0.00% |
5.00% |
399,134 |
257,306 |
0 |
34,527 |
 |  | State Treasurer |
681,602 |
1 |
2 |
0 |
107,958 |
15.84% |
57.92% |
42.08% |
0.00% |
0.00% |
394,780 |
286,822 |
0 |
0 |
 |  | Attorney General |
691,810 |
1 |
2 |
0 |
196,287 |
28.37% |
61.81% |
33.43% |
0.00% |
4.76% |
427,583 |
231,296 |
0 |
32,931 |
 |  | State Auditor |
687,428 |
1 |
2 |
0 |
104,000 |
15.13% |
57.56% |
42.44% |
0.00% |
0.00% |
395,714 |
291,714 |
0 |
0 |
|
