| Map | Pie | Office | Total | D | R | I | Margin | %Margin | Dem | Rep | Ind | Oth. | Dem | Rep | Ind | Other | | | | | | | | | | | | | | | | | | |
|---|
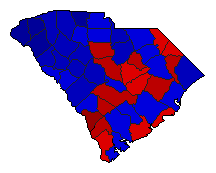
 |  | Governor |
1,707,569 |
2 |
1 |
0 |
137,160 |
8.03% |
45.92% |
53.96% |
0.00% |
0.12% |
784,182 |
921,342 |
0 |
2,045 |
 |  | Secretary of State |
1,699,496 |
2 |
1 |
0 |
242,624 |
14.28% |
42.83% |
57.11% |
0.00% |
0.06% |
727,952 |
970,576 |
0 |
968 |
 |  | State Treasurer |
1,701,900 |
2 |
1 |
0 |
229,256 |
13.47% |
42.48% |
55.95% |
0.00% |
1.57% |
722,977 |
952,233 |
0 |
26,690 |
 |  | Attorney General |
1,703,834 |
2 |
1 |
0 |
173,226 |
10.17% |
44.89% |
55.05% |
0.00% |
0.06% |
764,806 |
938,032 |
0 |
996 |
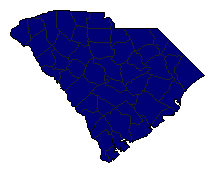 |  | Comptroller General |
1,162,960 |
0 |
1 |
0 |
1,110,904 |
95.52% |
0.00% |
97.76% |
0.00% |
2.24% |
0 |
1,136,932 |
0 |
26,028 |
 |  | Agriculture Commissioner |
1,341,300 |
0 |
1 |
0 |
813,128 |
60.62% |
0.00% |
75.70% |
0.00% |
24.30% |
0 |
1,015,366 |
0 |
325,934 |
|
