| Map | Pie | Office | Total | D | R | I | Margin | %Margin | Dem | Rep | Ind | Oth. | Dem | Rep | Ind | Other | | | | | | | | | | | | | | | | | | |
|---|
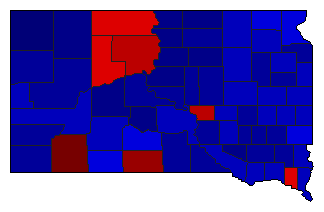
 |  | US Representative |
335,965 |
2 |
1 |
3 |
81,662 |
24.31% |
36.03% |
60.33% |
2.18% |
1.46% |
121,033 |
202,695 |
7,323 |
4,914 |
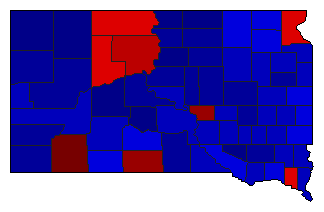
 |  | Governor |
339,214 |
2 |
1 |
0 |
11,458 |
3.38% |
47.60% |
50.97% |
0.00% |
1.43% |
161,454 |
172,912 |
0 |
4,848 |
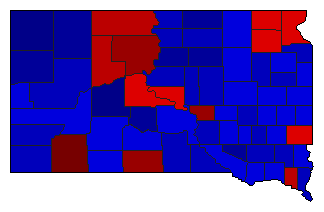
 |  | Secretary of State |
323,871 |
2 |
1 |
0 |
98,257 |
30.34% |
34.83% |
65.17% |
0.00% |
0.00% |
112,807 |
211,064 |
0 |
0 |
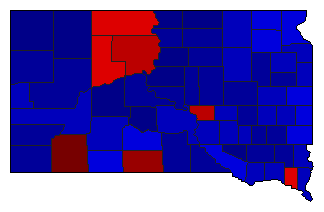
 |  | State Treasurer |
312,782 |
2 |
1 |
0 |
77,256 |
24.70% |
37.65% |
62.35% |
0.00% |
0.00% |
117,763 |
195,019 |
0 |
0 |
 |  | Attorney General |
324,629 |
2 |
1 |
0 |
33,513 |
10.32% |
44.84% |
55.16% |
0.00% |
0.00% |
145,558 |
179,071 |
0 |
0 |
 |  | State Auditor |
315,683 |
2 |
1 |
0 |
88,427 |
28.01% |
35.99% |
64.01% |
0.00% |
0.00% |
113,628 |
202,055 |
0 |
0 |
|
