| Map | Pie | Office | Total | D | R | I | Margin | %Margin | Dem | Rep | Ind | Oth. | Dem | Rep | Ind | Other | | | | | | | | | | | | | | | | | | |
|---|
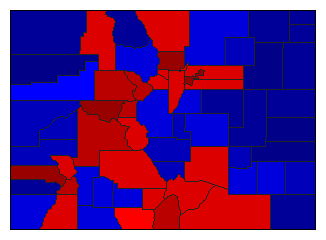
 |  | Governor |
2,525,062 |
1 |
2 |
0 |
268,087 |
10.62% |
53.42% |
42.80% |
0.00% |
3.78% |
1,348,888 |
1,080,801 |
0 |
95,373 |
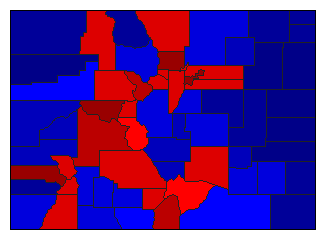
 |  | Secretary of State |
2,492,635 |
1 |
2 |
0 |
199,789 |
8.02% |
52.70% |
44.69% |
0.00% |
2.61% |
1,313,716 |
1,113,927 |
0 |
64,992 |
 |  | State Treasurer |
2,474,397 |
1 |
2 |
0 |
180,640 |
7.30% |
52.23% |
44.93% |
0.00% |
2.85% |
1,292,281 |
1,111,641 |
0 |
70,475 |
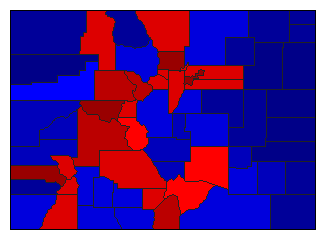 |  | Attorney General |
2,491,954 |
1 |
2 |
0 |
160,707 |
6.45% |
51.58% |
45.14% |
0.00% |
3.28% |
1,285,464 |
1,124,757 |
0 |
81,733 |
|
