| Map | Pie | Office | Total | D | R | I | Margin | %Margin | Dem | Rep | Ind | Oth. | Dem | Rep | Ind | Other | | | | | | | | | | | | | | | | | | |
|---|
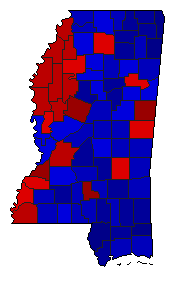
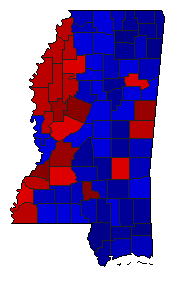
 |  | Governor |
884,911 |
2 |
1 |
3 |
45,028 |
5.09% |
46.83% |
51.91% |
0.96% |
0.30% |
414,368 |
459,396 |
8,522 |
2,625 |
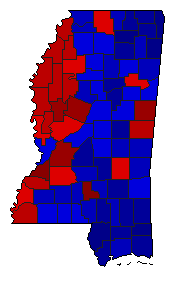
 |  | Lt. Governor |
874,384 |
2 |
1 |
0 |
175,130 |
20.03% |
39.99% |
60.01% |
0.00% |
0.00% |
349,627 |
524,757 |
0 |
0 |
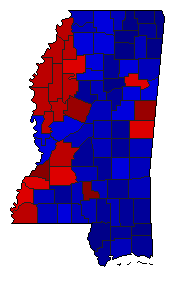
 |  | Secretary of State |
869,055 |
2 |
1 |
0 |
153,443 |
17.66% |
41.17% |
58.83% |
0.00% |
0.00% |
357,806 |
511,249 |
0 |
0 |
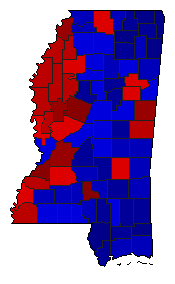
 |  | State Treasurer |
869,861 |
2 |
1 |
0 |
187,937 |
21.61% |
39.20% |
60.80% |
0.00% |
0.00% |
340,962 |
528,899 |
0 |
0 |
 |  | Attorney General |
877,536 |
2 |
1 |
0 |
137,400 |
15.66% |
42.17% |
57.83% |
0.00% |
0.00% |
370,068 |
507,468 |
0 |
0 |
 |  | State Auditor |
656,902 |
0 |
1 |
0 |
656,902 |
100.00% |
0.00% |
100.00% |
0.00% |
0.00% |
0 |
656,902 |
0 |
0 |
 |  | Insurance Commissioner |
870,621 |
2 |
1 |
0 |
196,027 |
22.52% |
38.74% |
61.26% |
0.00% |
0.00% |
337,297 |
533,324 |
0 |
0 |
 |  | Agriculture Commissioner |
867,557 |
2 |
1 |
0 |
150,921 |
17.40% |
41.30% |
58.70% |
0.00% |
0.00% |
358,318 |
509,239 |
0 |
0 |
|
