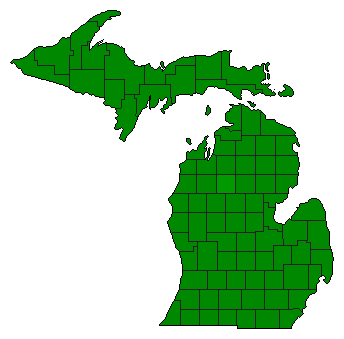
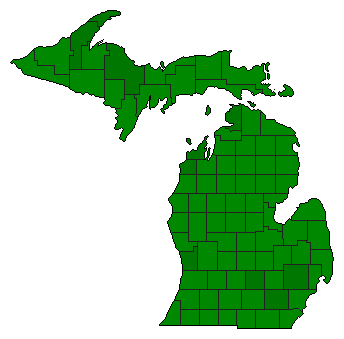
| Map | Pie | Office | Total | D | R | I | Margin | %Margin | Dem | Rep | Ind | Oth. | Dem | Rep | Ind | Other | | | | | | | | | | | | | | | | | | |
|---|
 |  | President |
5,547,186 |
1 |
2 |
0 |
154,181 |
2.78% |
50.55% |
47.77% |
0.00% |
1.68% |
2,804,045 |
2,649,864 |
0 |
93,277 |
 |  | Senator |
5,479,720 |
1 |
2 |
0 |
92,335 |
1.69% |
49.90% |
48.22% |
0.00% |
1.88% |
2,734,568 |
2,642,233 |
0 |
102,919 |
| | | Map | Pie | Initiative | Total Vote | N | | Y | Margin | %Margin | No | | Yes | Oth. | No | | Yes | |
 |  | Referendum |
4,929,254 |
2 |
0 |
1 |
3,380,236 |
68.58% |
15.71% |
0.00% |
84.29% |
0.00% |
774,509 |
0 |
4,154,745 |
0 |
 |  | Referendum |
5,039,801 |
2 |
0 |
1 |
3,905,541 |
77.49% |
11.25% |
0.00% |
88.75% |
0.00% |
567,130 |
0 |
4,472,671 |
0 |
|