| Map | Pie | Office | Total | D | R | I | Margin | %Margin | Dem | Rep | Ind | Oth. | Dem | Rep | Ind | Other | | | | | | | | | | | | | | | | | | |
|---|
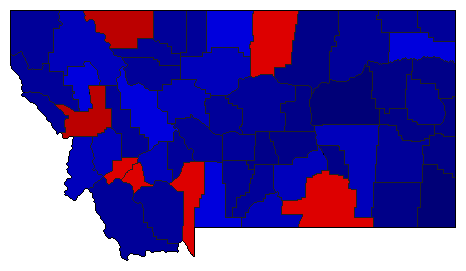
 |  | President |
605,570 |
2 |
1 |
0 |
98,816 |
16.32% |
40.42% |
56.74% |
0.00% |
2.84% |
244,786 |
343,602 |
0 |
17,182 |
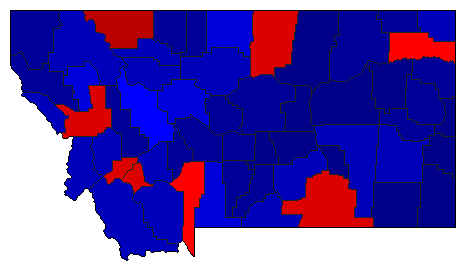
 |  | Senator |
605,637 |
2 |
1 |
0 |
60,711 |
10.02% |
44.99% |
55.01% |
0.00% |
0.00% |
272,463 |
333,174 |
0 |
0 |
 |  | US Representative |
601,509 |
2 |
1 |
0 |
76,829 |
12.77% |
43.61% |
56.39% |
0.00% |
0.00% |
262,340 |
339,169 |
0 |
0 |
 |  | Governor |
603,608 |
2 |
1 |
0 |
77,688 |
12.87% |
41.56% |
54.43% |
0.00% |
4.01% |
250,860 |
328,548 |
0 |
24,200 |
 |  | Secretary of State |
592,556 |
2 |
1 |
0 |
113,322 |
19.12% |
40.44% |
59.56% |
0.00% |
0.00% |
239,617 |
352,939 |
0 |
0 |
 |  | Attorney General |
595,347 |
2 |
1 |
0 |
101,297 |
17.01% |
41.49% |
58.51% |
0.00% |
0.00% |
247,025 |
348,322 |
0 |
0 |
 |  | State Auditor |
590,643 |
2 |
1 |
0 |
94,108 |
15.93% |
39.39% |
55.32% |
0.00% |
5.29% |
232,634 |
326,742 |
0 |
31,267 |
|
