| Map | Pie | Office | Total | D | R | I | Margin | %Margin | Dem | Rep | Ind | Oth. | Dem | Rep | Ind | Other | | | | | | | | | | | | | | | | | | |
|---|
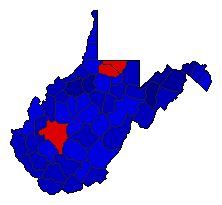
 |  | President |
794,731 |
2 |
1 |
11 |
309,398 |
38.93% |
29.69% |
68.62% |
0.00% |
1.68% |
235,984 |
545,382 |
5 |
13,360 |
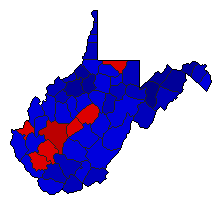
 |  | Senator |
778,918 |
2 |
1 |
0 |
337,145 |
43.28% |
27.00% |
70.28% |
0.00% |
2.72% |
210,309 |
547,454 |
0 |
21,155 |
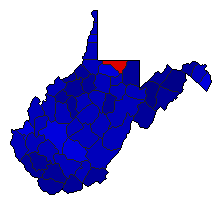
 |  | Governor |
784,287 |
2 |
1 |
0 |
260,920 |
33.27% |
30.22% |
63.49% |
0.00% |
6.29% |
237,024 |
497,944 |
0 |
49,319 |
 |  | Secretary of State |
768,187 |
2 |
1 |
0 |
126,887 |
16.52% |
41.74% |
58.26% |
0.00% |
0.00% |
320,650 |
447,537 |
0 |
0 |
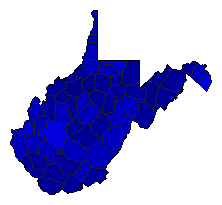
 |  | State Treasurer |
756,061 |
2 |
1 |
0 |
95,429 |
12.62% |
43.69% |
56.31% |
0.00% |
0.00% |
330,316 |
425,745 |
0 |
0 |
 |  | Attorney General |
764,048 |
2 |
1 |
0 |
210,452 |
27.54% |
36.23% |
63.77% |
0.00% |
0.00% |
276,798 |
487,250 |
0 |
0 |
 |  | State Auditor |
741,272 |
2 |
1 |
0 |
252,418 |
34.05% |
32.97% |
67.03% |
0.00% |
0.00% |
244,427 |
496,845 |
0 |
0 |
 |  | Agriculture Commissioner |
739,298 |
2 |
1 |
0 |
221,474 |
29.96% |
35.02% |
64.98% |
0.00% |
0.00% |
258,912 |
480,386 |
0 |
0 |
|
