| Map | Pie | Office | Total | D | R | I | Margin | %Margin | Dem | Rep | Ind | Oth. | Dem | Rep | Ind | Other | | | | | | | | | | | | | | | | | | |
|---|
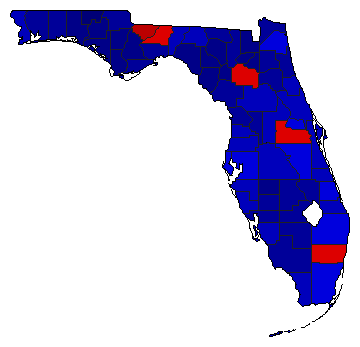
 |  | Senator |
7,761,094 |
2 |
1 |
4 |
1,273,325 |
16.41% |
41.25% |
57.66% |
0.41% |
0.68% |
3,201,522 |
4,474,847 |
31,816 |
52,909 |
 |  | Governor |
7,771,399 |
2 |
1 |
3 |
1,507,897 |
19.40% |
39.97% |
59.37% |
0.41% |
0.25% |
3,106,313 |
4,614,210 |
31,577 |
19,299 |
 |  | Attorney General |
7,677,335 |
2 |
1 |
0 |
1,625,417 |
21.17% |
39.41% |
60.59% |
0.00% |
0.00% |
3,025,959 |
4,651,376 |
0 |
0 |
 |  | State Treasurer |
7,614,508 |
2 |
1 |
0 |
1,443,114 |
18.95% |
40.52% |
59.48% |
0.00% |
0.00% |
3,085,697 |
4,528,811 |
0 |
0 |
 |  | Agriculture Commissioner |
7,606,430 |
2 |
1 |
0 |
1,414,858 |
18.60% |
40.70% |
59.30% |
0.00% |
0.00% |
3,095,786 |
4,510,644 |
0 |
0 |
| | | Map | Pie | Initiative | Total Vote | N | | Y | Margin | %Margin | No | | Yes | Oth. | No | | Yes | |
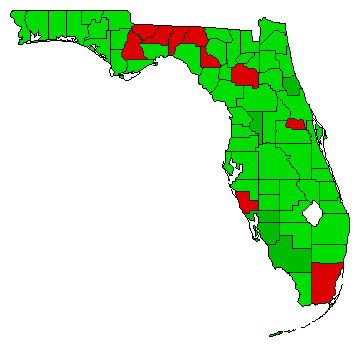
 |  | Referendum |
7,013,074 |
2 |
0 |
1 |
1,018,824 |
14.53% |
42.74% |
0.00% |
57.26% |
0.00% |
2,997,125 |
0 |
4,015,949 |
0 |
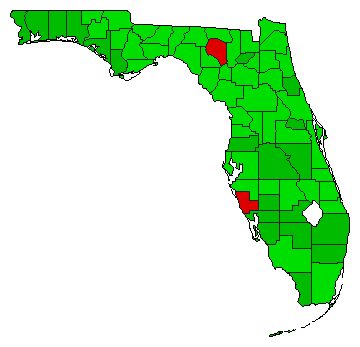
 |  | Referendum |
6,951,590 |
2 |
0 |
1 |
538,156 |
7.74% |
46.13% |
0.00% |
53.87% |
0.00% |
3,206,717 |
0 |
3,744,873 |
0 |
 |  | Referendum |
7,184,228 |
2 |
0 |
1 |
1,246,856 |
17.36% |
41.32% |
0.00% |
58.68% |
0.00% |
2,968,686 |
0 |
4,215,542 |
0 |
|
