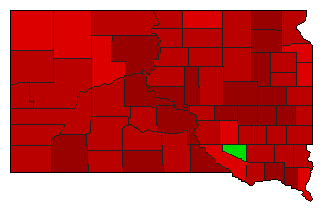
| Map | Pie | Office | Total | D | R | I | Margin | %Margin | Dem | Rep | Ind | Oth. | Dem | Rep | Ind | Other | | | | | | | | | | | | | | | | | | |
|---|
 |  | Senator |
348,020 |
2 |
1 |
0 |
151,309 |
43.48% |
26.15% |
69.63% |
0.00% |
4.22% |
91,007 |
242,316 |
0 |
14,697 |
 |  | US Representative |
327,841 |
0 |
1 |
0 |
179,801 |
54.84% |
0.00% |
77.42% |
0.00% |
22.58% |
0 |
253,821 |
0 |
74,020 |
 |  | Governor |
350,166 |
2 |
1 |
0 |
93,887 |
26.81% |
35.17% |
61.98% |
0.00% |
2.85% |
123,148 |
217,035 |
0 |
9,983 |
 |  | Secretary of State |
332,323 |
2 |
1 |
0 |
92,373 |
27.80% |
36.10% |
63.90% |
0.00% |
0.00% |
119,975 |
212,348 |
0 |
0 |
 |  | State Treasurer |
327,250 |
2 |
1 |
0 |
111,418 |
34.05% |
32.98% |
67.02% |
0.00% |
0.00% |
107,916 |
219,334 |
0 |
0 |
 |  | Attorney General |
257,419 |
0 |
1 |
0 |
257,419 |
100.00% |
0.00% |
100.00% |
0.00% |
0.00% |
0 |
257,419 |
0 |
0 |
 |  | State Auditor |
329,797 |
2 |
1 |
0 |
101,470 |
30.77% |
31.89% |
62.65% |
0.00% |
5.46% |
105,163 |
206,633 |
0 |
18,001 |
| | | Map | Pie | Initiative | Total Vote | N | | Y | Margin | %Margin | No | | Yes | Oth. | No | | Yes | |
 |  | Referendum |
181,542 |
1 |
0 |
2 |
63,292 |
34.86% |
67.43% |
0.00% |
32.57% |
0.00% |
122,417 |
0 |
59,125 |
0 |
|

