2000 Presidential General Election Data Graphs - Minnesota
Note: The Google advertisement links below may advocate political positions that this site does not endorse.
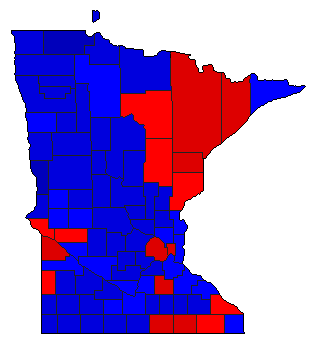
Map

AitkinGore46.4%
 
Bush45.5%
 
Nader4.9%
 
Other3.3%


AnokaGore46.7%
 
Bush47.6%
 
Nader4.5%
 
Other1.2%


BeckerGore36.6%
 
Bush56.9%
 
Nader4.1%
 
Other2.4%


BeltramiGore42.4%
 
Bush48.5%
 
Nader7.4%
 
Other1.7%


BentonGore40.3%
 
Bush51.4%
 
Nader5.8%
 
Other2.5%


Big StoneGore48.0%
 
Bush46.0%
 
Nader3.7%
 
Other2.4%


Blue EarthGore45.0%
 
Bush47.2%
 
Nader6.4%
 
Other1.4%


BrownGore36.2%
 
Bush57.4%
 
Nader4.4%
 
Other2.0%


CarltonGore57.2%
 
Bush37.0%
 
Nader4.2%
 
Other1.7%


CarverGore35.6%
 
Bush59.4%
 
Nader3.9%
 
Other1.1%


CassGore40.7%
 
Bush52.5%
 
Nader4.9%
 
Other1.9%


ChippewaGore46.5%
 
Bush46.9%
 
Nader4.2%
 
Other2.4%


ChisagoGore43.6%
 
Bush49.7%
 
Nader5.1%
 
Other1.6%


ClayGore43.4%
 
Bush50.1%
 
Nader4.1%
 
Other2.4%


ClearwaterGore38.3%
 
Bush55.9%
 
Nader3.5%
 
Other2.3%


CookGore41.5%
 
Bush45.9%
 
Nader10.3%
 
Other2.3%


CottonwoodGore40.5%
 
Bush54.5%
 
Nader3.4%
 
Other1.6%


Crow WingGore40.0%
 
Bush53.5%
 
Nader4.7%
 
Other1.9%


DakotaGore46.9%
 
Bush47.9%
 
Nader4.3%
 
Other1.0%


DodgeGore41.9%
 
Bush52.3%
 
Nader4.1%
 
Other1.7%


DouglasGore36.9%
 
Bush57.0%
 
Nader4.3%
 
Other1.7%


FaribaultGore43.0%
 
Bush51.5%
 
Nader3.7%
 
Other1.8%


FillmoreGore49.1%
 
Bush45.4%
 
Nader4.0%
 
Other1.4%


FreebornGore52.8%
 
Bush42.4%
 
Nader3.4%
 
Other1.4%


GoodhueGore44.8%
 
Bush48.8%
 
Nader4.9%
 
Other1.5%


GrantGore41.6%
 
Bush49.8%
 
Nader5.9%
 
Other2.7%


HennepinGore53.6%
 
Bush39.3%
 
Nader6.2%
 
Other0.9%


HoustonGore44.3%
 
Bush49.9%
 
Nader4.1%
 
Other1.6%


HubbardGore37.8%
 
Bush55.2%
 
Nader5.0%
 
Other2.0%


IsantiGore41.8%
 
Bush51.4%
 
Nader5.0%
 
Other1.7%


ItascaGore48.7%
 
Bush44.0%
 
Nader5.2%
 
Other2.1%


JacksonGore43.5%
 
Bush51.0%
 
Nader3.6%
 
Other2.0%


KanabecGore41.6%
 
Bush51.1%
 
Nader5.1%
 
Other2.3%


KandiyohiGore42.6%
 
Bush52.0%
 
Nader3.8%
 
Other1.6%


KittsonGore42.0%
 
Bush51.3%
 
Nader2.6%
 
Other4.1%


KoochichingGore42.2%
 
Bush51.2%
 
Nader4.4%
 
Other2.2%


Lac Qui ParleGore50.4%
 
Bush43.6%
 
Nader3.6%
 
Other2.4%


LakeGore54.5%
 
Bush37.6%
 
Nader6.5%
 
Other1.4%


Lake of the WoodsGore38.8%
 
Bush55.6%
 
Nader3.4%
 
Other2.2%


Le SueurGore43.5%
 
Bush49.8%
 
Nader4.9%
 
Other1.9%


LincolnGore48.4%
 
Bush46.1%
 
Nader3.2%
 
Other2.3%


LyonGore41.2%
 
Bush53.0%
 
Nader4.0%
 
Other1.8%


McLeodGore36.4%
 
Bush57.0%
 
Nader4.4%
 
Other2.1%


MahnomenGore41.4%
 
Bush50.4%
 
Nader4.3%
 
Other3.8%


MarshallGore36.7%
 
Bush56.0%
 
Nader3.1%
 
Other4.2%


MartinGore40.2%
 
Bush54.8%
 
Nader3.6%
 
Other1.4%


MeekerGore41.2%
 
Bush51.7%
 
Nader4.8%
 
Other2.2%


Mille LacsGore42.7%
 
Bush50.9%
 
Nader4.4%
 
Other2.0%


MorrisonGore35.9%
 
Bush55.8%
 
Nader4.3%
 
Other3.9%


MowerGore57.9%
 
Bush37.2%
 
Nader3.7%
 
Other1.3%


MurrayGore44.0%
 
Bush50.6%
 
Nader3.1%
 
Other2.2%


NicolletGore45.9%
 
Bush47.1%
 
Nader5.5%
 
Other1.5%


NoblesGore42.4%
 
Bush53.7%
 
Nader2.7%
 
Other1.2%


NormanGore43.3%
 
Bush49.7%
 
Nader3.4%
 
Other3.7%


OlmstedGore43.5%
 
Bush51.6%
 
Nader3.7%
 
Other1.2%


Otter TailGore34.5%
 
Bush59.5%
 
Nader3.9%
 
Other2.0%


PenningtonGore38.9%
 
Bush53.5%
 
Nader4.0%
 
Other3.6%


PineGore47.0%
 
Bush44.8%
 
Nader5.6%
 
Other2.5%


PipestoneGore40.3%
 
Bush55.0%
 
Nader2.9%
 
Other1.9%


PolkGore40.8%
 
Bush53.8%
 
Nader2.6%
 
Other2.8%


PopeGore46.3%
 
Bush46.9%
 
Nader4.4%
 
Other2.4%


RamseyGore56.7%
 
Bush35.9%
 
Nader6.4%
 
Other1.1%


Red LakeGore39.7%
 
Bush52.2%
 
Nader3.3%
 
Other4.9%


RedwoodGore34.6%
 
Bush59.2%
 
Nader4.1%
 
Other2.1%


RenvilleGore43.5%
 
Bush49.7%
 
Nader4.4%
 
Other2.4%


RiceGore50.5%
 
Bush41.8%
 
Nader6.3%
 
Other1.4%


RockGore41.5%
 
Bush55.3%
 
Nader2.3%
 
Other0.8%


RoseauGore29.7%
 
Bush65.5%
 
Nader2.5%
 
Other2.3%


St. LouisGore59.8%
 
Bush33.0%
 
Nader5.9%
 
Other1.4%


ScottGore40.0%
 
Bush54.7%
 
Nader4.2%
 
Other1.2%


SherburneGore39.3%
 
Bush54.5%
 
Nader4.9%
 
Other1.3%


SibleyGore36.6%
 
Bush55.7%
 
Nader4.9%
 
Other2.7%


StearnsGore39.7%
 
Bush51.9%
 
Nader6.1%
 
Other2.3%


SteeleGore42.9%
 
Bush51.2%
 
Nader4.3%
 
Other1.5%


StevensGore42.3%
 
Bush49.2%
 
Nader6.8%
 
Other1.6%


SwiftGore49.6%
 
Bush43.7%
 
Nader4.0%
 
Other2.7%


ToddGore37.3%
 
Bush54.4%
 
Nader4.4%
 
Other4.0%


TraverseGore42.0%
 
Bush51.0%
 
Nader4.1%
 
Other2.9%


WabashaGore42.9%
 
Bush49.8%
 
Nader5.4%
 
Other1.8%


WadenaGore35.3%
 
Bush58.5%
 
Nader4.0%
 
Other2.3%


WasecaGore41.7%
 
Bush52.0%
 
Nader4.5%
 
Other1.9%


WashingtonGore46.4%
 
Bush48.1%
 
Nader4.6%
 
Other0.9%


WatonwanGore44.0%
 
Bush49.9%
 
Nader4.1%
 
Other2.0%


WilkinGore31.6%
 
Bush61.5%
 
Nader2.3%
 
Other4.5%


WinonaGore46.3%
 
Bush45.0%
 
Nader7.3%
 
Other1.4%


WrightGore38.7%
 
Bush55.0%
 
Nader4.6%
 
Other1.8%


Yellow MedicineGore45.8%
 
Bush47.1%
 
Nader4.2%
 
Other2.8%


National DataGraph for 2000 - Minnesota Results for 2000

Login

Terms of Use - DCMA Policy - Privacy Policy and Cookies


© Dave Leip's Atlas of U.S. Elections, LLC 2019 All Rights Reserved