1974 Gubernatorial General Election Data Graphs - Ohio
Note: The Google advertisement links below may advocate political positions that this site does not endorse.
Data for this Contest was Contributed by on 2019-04-22
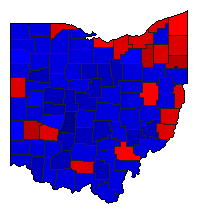
Map

AdamsGilligan41.4%
 
Rhodes57.1%
 
Other1.5%


AllenGilligan35.3%
 
Rhodes61.3%
 
Other3.4%


AshlandGilligan33.3%
 
Rhodes63.3%
 
Other3.5%


AshtabulaGilligan49.0%
 
Rhodes46.1%
 
Other4.8%


AthensGilligan49.5%
 
Rhodes46.8%
 
Other3.8%


AuglaizeGilligan41.5%
 
Rhodes54.4%
 
Other4.2%


BelmontGilligan52.6%
 
Rhodes44.1%
 
Other3.3%


BrownGilligan42.7%
 
Rhodes54.7%
 
Other2.6%


ButlerGilligan38.0%
 
Rhodes59.2%
 
Other2.9%


CarrollGilligan36.6%
 
Rhodes59.5%
 
Other3.9%


ChampaignGilligan36.4%
 
Rhodes61.2%
 
Other2.5%


ClarkGilligan47.9%
 
Rhodes49.8%
 
Other2.3%


ClermontGilligan35.7%
 
Rhodes61.1%
 
Other3.3%


ClintonGilligan37.3%
 
Rhodes59.6%
 
Other3.0%


ColumbianaGilligan43.8%
 
Rhodes51.7%
 
Other4.5%


CoshoctonGilligan41.2%
 
Rhodes56.5%
 
Other2.3%


CrawfordGilligan31.3%
 
Rhodes64.9%
 
Other3.9%


CuyahogaGilligan58.4%
 
Rhodes39.2%
 
Other2.4%


DarkeGilligan38.5%
 
Rhodes54.5%
 
Other7.0%


DefianceGilligan44.2%
 
Rhodes51.3%
 
Other4.4%


DelawareGilligan31.8%
 
Rhodes65.5%
 
Other2.7%


ErieGilligan49.8%
 
Rhodes47.7%
 
Other2.5%


FairfieldGilligan33.4%
 
Rhodes63.3%
 
Other3.3%


FayetteGilligan32.8%
 
Rhodes64.8%
 
Other2.4%


FranklinGilligan41.4%
 
Rhodes56.7%
 
Other1.8%


FultonGilligan38.1%
 
Rhodes56.8%
 
Other5.1%


GalliaGilligan38.9%
 
Rhodes59.6%
 
Other1.5%


GeaugaGilligan45.5%
 
Rhodes51.8%
 
Other2.7%


GreeneGilligan52.5%
 
Rhodes43.7%
 
Other3.8%


GuernseyGilligan39.5%
 
Rhodes57.7%
 
Other2.8%


HamiltonGilligan44.7%
 
Rhodes53.5%
 
Other1.9%


HancockGilligan38.3%
 
Rhodes58.4%
 
Other3.2%


HardinGilligan41.5%
 
Rhodes55.7%
 
Other2.7%


HarrisonGilligan38.7%
 
Rhodes57.9%
 
Other3.4%


HenryGilligan36.1%
 
Rhodes59.6%
 
Other4.3%


HighlandGilligan38.0%
 
Rhodes60.3%
 
Other1.7%


HockingGilligan40.2%
 
Rhodes57.3%
 
Other2.5%


HolmesGilligan39.8%
 
Rhodes56.5%
 
Other3.7%


HuronGilligan41.8%
 
Rhodes55.1%
 
Other3.1%


JacksonGilligan35.1%
 
Rhodes63.3%
 
Other1.5%


JeffersonGilligan51.7%
 
Rhodes45.1%
 
Other3.3%


KnoxGilligan41.7%
 
Rhodes54.7%
 
Other3.6%


LakeGilligan52.0%
 
Rhodes45.7%
 
Other2.4%


LawrenceGilligan43.6%
 
Rhodes54.2%
 
Other2.2%


LickingGilligan36.6%
 
Rhodes59.6%
 
Other3.8%


LoganGilligan30.4%
 
Rhodes65.4%
 
Other4.2%


LorainGilligan51.1%
 
Rhodes45.5%
 
Other3.3%


LucasGilligan58.9%
 
Rhodes38.2%
 
Other2.8%


MadisonGilligan26.7%
 
Rhodes70.6%
 
Other2.7%


MahoningGilligan62.4%
 
Rhodes33.7%
 
Other3.9%


MarionGilligan38.5%
 
Rhodes58.1%
 
Other3.4%


MedinaGilligan47.7%
 
Rhodes48.0%
 
Other4.3%


MeigsGilligan38.7%
 
Rhodes58.8%
 
Other2.5%


MercerGilligan57.6%
 
Rhodes38.6%
 
Other3.8%


MiamiGilligan42.8%
 
Rhodes52.4%
 
Other4.8%


MonroeGilligan52.2%
 
Rhodes45.0%
 
Other2.7%


MontgomeryGilligan60.3%
 
Rhodes36.9%
 
Other2.8%


MorganGilligan31.3%
 
Rhodes65.0%
 
Other3.6%


MorrowGilligan32.6%
 
Rhodes63.6%
 
Other3.8%


MuskingumGilligan37.2%
 
Rhodes59.3%
 
Other3.5%


NobleGilligan36.3%
 
Rhodes60.7%
 
Other3.0%


OttawaGilligan44.2%
 
Rhodes50.6%
 
Other5.2%


PauldingGilligan45.9%
 
Rhodes48.5%
 
Other5.6%


PerryGilligan40.3%
 
Rhodes56.2%
 
Other3.5%


PickawayGilligan31.5%
 
Rhodes66.5%
 
Other2.0%


PikeGilligan50.3%
 
Rhodes48.4%
 
Other1.3%


PortageGilligan56.4%
 
Rhodes38.5%
 
Other5.1%


PrebleGilligan46.8%
 
Rhodes48.1%
 
Other5.1%


PutnamGilligan40.9%
 
Rhodes53.4%
 
Other5.7%


RichlandGilligan33.0%
 
Rhodes63.2%
 
Other3.8%


RossGilligan40.4%
 
Rhodes58.0%
 
Other1.6%


SanduskyGilligan37.5%
 
Rhodes56.9%
 
Other5.6%


SciotoGilligan40.2%
 
Rhodes57.8%
 
Other2.1%


SenecaGilligan40.5%
 
Rhodes54.4%
 
Other5.1%


ShelbyGilligan46.4%
 
Rhodes48.6%
 
Other4.9%


StarkGilligan40.8%
 
Rhodes54.5%
 
Other4.7%


SummitGilligan61.2%
 
Rhodes34.4%
 
Other4.4%


TrumbullGilligan53.6%
 
Rhodes42.1%
 
Other4.3%


TuscarawasGilligan48.6%
 
Rhodes46.9%
 
Other4.5%


UnionGilligan28.3%
 
Rhodes68.9%
 
Other2.8%


Van WertGilligan41.8%
 
Rhodes54.9%
 
Other3.2%


VintonGilligan41.4%
 
Rhodes55.1%
 
Other3.5%


WarrenGilligan38.1%
 
Rhodes58.1%
 
Other3.7%


WashingtonGilligan42.2%
 
Rhodes55.4%
 
Other2.5%


WayneGilligan43.2%
 
Rhodes52.4%
 
Other4.4%


WilliamsGilligan41.5%
 
Rhodes54.7%
 
Other3.8%


WoodGilligan44.2%
 
Rhodes51.4%
 
Other4.4%


WyandotGilligan38.8%
 
Rhodes57.5%
 
Other3.6%


National DataGraph for 1974 - Ohio Results for 1974

Login

Terms of Use - DCMA Policy - Privacy Policy and Cookies


© Dave Leip's Atlas of U.S. Elections, LLC 2019 All Rights Reserved