2018 Gubernatorial General Election Data Graphs - Arizona
Note: The Google advertisement links below may advocate political positions that this site does not endorse.
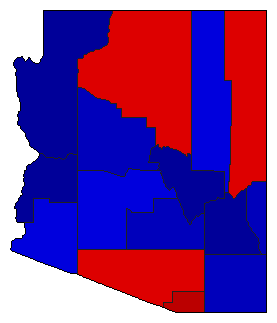
Map

ApacheGarcia59.7%
 
Ducey36.6%
 
0.0%
 
Other3.7%


CochiseGarcia32.1%
 
Ducey65.2%
 
0.0%
 
Other2.7%


CoconinoGarcia55.9%
 
Ducey41.5%
 
0.0%
 
Other2.6%


GilaGarcia27.4%
 
Ducey70.3%
 
0.0%
 
Other2.3%


GrahamGarcia24.2%
 
Ducey73.2%
 
0.0%
 
Other2.6%


GreenleeGarcia32.6%
 
Ducey64.2%
 
0.0%
 
Other3.1%


La PazGarcia22.0%
 
Ducey75.5%
 
0.0%
 
Other2.5%


MaricopaGarcia42.1%
 
Ducey55.8%
 
0.0%
 
Other2.1%


MohaveGarcia19.0%
 
Ducey79.2%
 
0.0%
 
Other1.9%


NavajoGarcia37.3%
 
Ducey59.8%
 
0.0%
 
Other2.9%


PimaGarcia50.2%
 
Ducey47.5%
 
0.0%
 
Other2.2%


PinalGarcia33.2%
 
Ducey64.4%
 
0.0%
 
Other2.4%


Santa CruzGarcia62.5%
 
Ducey35.6%
 
0.0%
 
Other1.9%


YavapaiGarcia29.7%
 
Ducey68.4%
 
0.0%
 
Other1.9%


YumaGarcia43.5%
 
Ducey54.6%
 
0.0%
 
Other1.9%


National DataGraph for 2018 - Arizona Results for 2018

Login

Terms of Use - DCMA Policy - Privacy Policy and Cookies


© Dave Leip's Atlas of U.S. Elections, LLC 2019 All Rights Reserved