2018 Gubernatorial General Election Data Graphs - Pennsylvania
Note: The Google advertisement links below may advocate political positions that this site does not endorse.
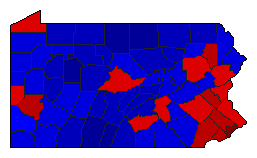
Map

AdamsWolf40.6%
 
Wagner57.6%
 
0.0%
 
Other1.8%


AlleghenyWolf67.4%
 
Wagner31.2%
 
0.0%
 
Other1.4%


ArmstrongWolf35.9%
 
Wagner62.4%
 
0.0%
 
Other1.7%


BeaverWolf53.3%
 
Wagner45.1%
 
0.0%
 
Other1.6%


BedfordWolf23.4%
 
Wagner75.6%
 
0.0%
 
Other1.0%


BerksWolf52.7%
 
Wagner45.5%
 
0.0%
 
Other1.8%


BlairWolf33.6%
 
Wagner64.7%
 
0.0%
 
Other1.7%


BradfordWolf33.6%
 
Wagner64.0%
 
0.0%
 
Other2.4%


BucksWolf58.5%
 
Wagner40.1%
 
0.0%
 
Other1.4%


ButlerWolf41.3%
 
Wagner56.8%
 
0.0%
 
Other2.0%


CambriaWolf43.4%
 
Wagner55.2%
 
0.0%
 
Other1.5%


CameronWolf34.9%
 
Wagner63.6%
 
0.0%
 
Other1.5%


CarbonWolf42.8%
 
Wagner55.3%
 
0.0%
 
Other1.8%


CentreWolf57.6%
 
Wagner40.1%
 
0.0%
 
Other2.2%


ChesterWolf61.3%
 
Wagner37.1%
 
0.0%
 
Other1.6%


ClarionWolf36.8%
 
Wagner61.0%
 
0.0%
 
Other2.2%


ClearfieldWolf34.3%
 
Wagner64.1%
 
0.0%
 
Other1.5%


ClintonWolf44.2%
 
Wagner53.9%
 
0.0%
 
Other1.9%


ColumbiaWolf43.4%
 
Wagner54.9%
 
0.0%
 
Other1.7%


CrawfordWolf39.7%
 
Wagner58.5%
 
0.0%
 
Other1.8%


CumberlandWolf50.5%
 
Wagner47.4%
 
0.0%
 
Other2.1%


DauphinWolf59.0%
 
Wagner39.1%
 
0.0%
 
Other1.9%


DelawareWolf66.7%
 
Wagner32.1%
 
0.0%
 
Other1.1%


ElkWolf37.2%
 
Wagner61.2%
 
0.0%
 
Other1.6%


ErieWolf59.8%
 
Wagner38.7%
 
0.0%
 
Other1.5%


FayetteWolf48.4%
 
Wagner50.0%
 
0.0%
 
Other1.6%


ForestWolf38.5%
 
Wagner59.8%
 
0.0%
 
Other1.7%


FranklinWolf33.6%
 
Wagner64.9%
 
0.0%
 
Other1.5%


FultonWolf19.6%
 
Wagner79.3%
 
0.0%
 
Other1.1%


GreeneWolf46.9%
 
Wagner51.3%
 
0.0%
 
Other1.8%


HuntingdonWolf31.7%
 
Wagner66.6%
 
0.0%
 
Other1.7%


IndianaWolf43.3%
 
Wagner55.0%
 
0.0%
 
Other1.7%


JeffersonWolf27.5%
 
Wagner70.9%
 
0.0%
 
Other1.7%


JuniataWolf30.0%
 
Wagner68.1%
 
0.0%
 
Other1.9%


LackawannaWolf64.6%
 
Wagner34.1%
 
0.0%
 
Other1.3%


LancasterWolf47.5%
 
Wagner50.6%
 
0.0%
 
Other2.0%


LawrenceWolf46.6%
 
Wagner51.8%
 
0.0%
 
Other1.5%


LebanonWolf41.1%
 
Wagner57.2%
 
0.0%
 
Other1.7%


LehighWolf60.1%
 
Wagner38.2%
 
0.0%
 
Other1.8%


LuzerneWolf51.7%
 
Wagner47.0%
 
0.0%
 
Other1.3%


LycomingWolf35.9%
 
Wagner62.3%
 
0.0%
 
Other1.8%


McKeanWolf31.0%
 
Wagner67.6%
 
0.0%
 
Other1.4%


MercerWolf44.3%
 
Wagner54.0%
 
0.0%
 
Other1.7%


MifflinWolf30.0%
 
Wagner68.4%
 
0.0%
 
Other1.5%


MonroeWolf57.8%
 
Wagner40.6%
 
0.0%
 
Other1.5%


MontgomeryWolf67.2%
 
Wagner31.5%
 
0.0%
 
Other1.3%


MontourWolf46.0%
 
Wagner51.9%
 
0.0%
 
Other2.1%


NorthamptonWolf57.1%
 
Wagner41.3%
 
0.0%
 
Other1.6%


NorthumberlandWolf42.1%
 
Wagner55.9%
 
0.0%
 
Other2.0%


PerryWolf34.3%
 
Wagner63.5%
 
0.0%
 
Other2.2%


PhiladelphiaWolf87.4%
 
Wagner11.6%
 
0.0%
 
Other1.0%


PikeWolf43.6%
 
Wagner54.8%
 
0.0%
 
Other1.5%


PotterWolf23.2%
 
Wagner75.0%
 
0.0%
 
Other1.7%


SchuylkillWolf43.5%
 
Wagner54.7%
 
0.0%
 
Other1.8%


SnyderWolf36.3%
 
Wagner62.1%
 
0.0%
 
Other1.6%


SomersetWolf31.8%
 
Wagner66.2%
 
0.0%
 
Other2.0%


SullivanWolf36.2%
 
Wagner61.5%
 
0.0%
 
Other2.3%


SusquehannaWolf33.5%
 
Wagner64.5%
 
0.0%
 
Other2.0%


TiogaWolf27.0%
 
Wagner70.9%
 
0.0%
 
Other2.1%


UnionWolf44.6%
 
Wagner53.3%
 
0.0%
 
Other2.0%


VenangoWolf39.9%
 
Wagner58.3%
 
0.0%
 
Other1.8%


WarrenWolf37.6%
 
Wagner60.5%
 
0.0%
 
Other1.9%


WashingtonWolf48.4%
 
Wagner49.3%
 
0.0%
 
Other2.3%


WayneWolf39.9%
 
Wagner58.5%
 
0.0%
 
Other1.6%


WestmorelandWolf46.4%
 
Wagner52.0%
 
0.0%
 
Other1.5%


WyomingWolf38.5%
 
Wagner59.6%
 
0.0%
 
Other1.9%


YorkWolf44.6%
 
Wagner53.6%
 
0.0%
 
Other1.8%


National DataGraph for 2018 - Pennsylvania Results for 2018

Login

Terms of Use - DCMA Policy - Privacy Policy and Cookies


© Dave Leip's Atlas of U.S. Elections, LLC 2019 All Rights Reserved