1972 Presidential General Election Data Graphs - South Carolina
Note: The Google advertisement links below may advocate political positions that this site does not endorse.
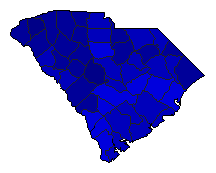
Map

AbbevilleMcGovern28.5%
 
Nixon68.9%
 
Other2.6%


AikenMcGovern21.0%
 
Nixon77.0%
 
Other2.0%


AllendaleMcGovern44.1%
 
Nixon55.3%
 
Other0.6%


AndersonMcGovern22.5%
 
Nixon75.2%
 
Other2.3%


BambergMcGovern39.5%
 
Nixon59.7%
 
Other0.8%


BarnwellMcGovern28.3%
 
Nixon71.7%


BeaufortMcGovern35.0%
 
Nixon64.1%
 
Other0.9%


BerkeleyMcGovern32.1%
 
Nixon66.7%
 
Other1.3%


CalhounMcGovern37.5%
 
Nixon60.9%
 
Other1.6%


CharlestonMcGovern29.1%
 
Nixon68.8%
 
Other2.1%


CherokeeMcGovern21.5%
 
Nixon77.2%
 
Other1.3%


ChesterMcGovern33.0%
 
Nixon66.2%
 
Other0.8%


ChesterfieldMcGovern35.7%
 
Nixon63.6%
 
Other0.7%


ClarendonMcGovern45.0%
 
Nixon54.3%
 
Other0.7%


ColletonMcGovern28.9%
 
Nixon69.5%
 
Other1.6%


DarlingtonMcGovern27.0%
 
Nixon72.0%
 
Other0.9%


DillonMcGovern26.6%
 
Nixon72.3%
 
Other1.1%


DorchesterMcGovern30.3%
 
Nixon68.1%
 
Other1.6%


EdgefieldMcGovern31.4%
 
Nixon66.7%
 
Other1.9%


FairfieldMcGovern48.4%
 
Nixon50.7%
 
Other0.9%


FlorenceMcGovern34.1%
 
Nixon65.3%
 
Other0.6%


GeorgetownMcGovern41.6%
 
Nixon57.3%
 
Other1.1%


GreenvilleMcGovern17.4%
 
Nixon79.6%
 
Other3.0%


GreenwoodMcGovern26.2%
 
Nixon72.2%
 
Other1.6%


HamptonMcGovern41.5%
 
Nixon57.6%
 
Other0.9%


HorryMcGovern22.2%
 
Nixon76.8%
 
Other0.9%


JasperMcGovern41.7%
 
Nixon57.2%
 
Other1.1%


KershawMcGovern23.6%
 
Nixon74.8%
 
Other1.7%


LancasterMcGovern21.3%
 
Nixon77.9%
 
Other0.9%


LaurensMcGovern24.2%
 
Nixon74.5%
 
Other1.3%


LeeMcGovern39.1%
 
Nixon60.3%
 
Other0.5%


LexingtonMcGovern13.6%
 
Nixon84.7%
 
Other1.6%


McCormickMcGovern39.0%
 
Nixon60.2%
 
Other0.7%


MarionMcGovern34.9%
 
Nixon64.7%
 
Other0.5%


MarlboroMcGovern34.2%
 
Nixon65.6%
 
Other0.3%


NewberryMcGovern21.4%
 
Nixon76.9%
 
Other1.7%


OconeeMcGovern19.9%
 
Nixon78.2%
 
Other1.9%


OrangeburgMcGovern38.8%
 
Nixon59.3%
 
Other1.9%


PickensMcGovern15.8%
 
Nixon82.4%
 
Other1.9%


RichlandMcGovern34.6%
 
Nixon64.1%
 
Other1.3%


SaludaMcGovern24.4%
 
Nixon73.8%
 
Other1.8%


SpartanburgMcGovern23.1%
 
Nixon75.3%
 
Other1.6%


SumterMcGovern34.5%
 
Nixon64.8%
 
Other0.6%


UnionMcGovern24.2%
 
Nixon75.3%
 
Other0.5%


WilliamsburgMcGovern47.3%
 
Nixon52.0%
 
Other0.7%


YorkMcGovern30.3%
 
Nixon68.7%
 
Other1.0%


National DataGraph for 1972 - South Carolina Results for 1972

Login

Terms of Use - DCMA Policy - Privacy Policy and Cookies


© Dave Leip's Atlas of U.S. Elections, LLC 2019 All Rights Reserved