2018 Gubernatorial General Election Data Graphs - South Carolina
Note: The Google advertisement links below may advocate political positions that this site does not endorse.
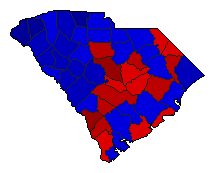
Map

AbbevilleSmith36.3%
 
McMaster63.6%
 
0.0%
 
Other0.1%


AikenSmith38.2%
 
McMaster61.7%
 
0.0%
 
Other0.1%


AllendaleSmith79.0%
 
McMaster21.0%
 
0.0%
 
Other0.0%


AndersonSmith30.8%
 
McMaster69.0%
 
0.0%
 
Other0.2%


BambergSmith64.5%
 
McMaster35.4%
 
0.0%
 
Other0.0%


BarnwellSmith48.7%
 
McMaster51.2%
 
0.0%
 
Other0.1%


BeaufortSmith45.4%
 
McMaster54.5%
 
0.0%
 
Other0.1%


BerkeleySmith46.4%
 
McMaster53.5%
 
0.0%
 
Other0.2%


CalhounSmith50.3%
 
McMaster49.6%
 
0.0%
 
Other0.1%


CharlestonSmith57.4%
 
McMaster42.5%
 
0.0%
 
Other0.1%


CherokeeSmith29.7%
 
McMaster70.2%
 
0.0%
 
Other0.1%


ChesterSmith47.8%
 
McMaster52.1%
 
0.0%
 
Other0.0%


ChesterfieldSmith43.8%
 
McMaster56.2%
 
0.0%
 
Other0.1%


ClarendonSmith52.6%
 
McMaster47.3%
 
0.0%
 
Other0.0%


ColletonSmith47.8%
 
McMaster52.1%
 
0.0%
 
Other0.1%


DarlingtonSmith49.0%
 
McMaster50.9%
 
0.0%
 
Other0.0%


DillonSmith50.5%
 
McMaster49.5%
 
0.0%
 
Other0.0%


DorchesterSmith45.7%
 
McMaster54.2%
 
0.0%
 
Other0.1%


EdgefieldSmith39.9%
 
McMaster60.0%
 
0.0%
 
Other0.1%


FairfieldSmith63.2%
 
McMaster36.7%
 
0.0%
 
Other0.1%


FlorenceSmith49.5%
 
McMaster50.4%
 
0.0%
 
Other0.1%


GeorgetownSmith45.5%
 
McMaster54.5%
 
0.0%
 
Other0.1%


GreenvilleSmith41.9%
 
McMaster57.9%
 
0.0%
 
Other0.2%


GreenwoodSmith39.5%
 
McMaster60.4%
 
0.0%
 
Other0.1%


HamptonSmith61.2%
 
McMaster38.6%
 
0.0%
 
Other0.2%


HorrySmith34.9%
 
McMaster65.1%
 
0.0%
 
Other0.1%


JasperSmith53.4%
 
McMaster46.4%
 
0.0%
 
Other0.1%


KershawSmith40.8%
 
McMaster59.1%
 
0.0%
 
Other0.1%


LancasterSmith40.5%
 
McMaster59.5%
 
0.0%
 
Other0.1%


LaurensSmith36.4%
 
McMaster63.4%
 
0.0%
 
Other0.2%


LeeSmith65.8%
 
McMaster34.1%
 
0.0%
 
Other0.1%


LexingtonSmith37.0%
 
McMaster62.8%
 
0.0%
 
Other0.2%


McCormickSmith47.5%
 
McMaster52.5%
 
0.0%
 
Other0.0%


MarionSmith61.9%
 
McMaster38.0%
 
0.0%
 
Other0.1%


MarlboroSmith59.1%
 
McMaster40.8%
 
0.0%
 
Other0.1%


NewberrySmith41.2%
 
McMaster58.7%
 
0.0%
 
Other0.1%


OconeeSmith28.8%
 
McMaster71.1%
 
0.0%
 
Other0.1%


OrangeburgSmith69.8%
 
McMaster30.1%
 
0.0%
 
Other0.1%


PickensSmith26.9%
 
McMaster72.9%
 
0.0%
 
Other0.2%


RichlandSmith70.3%
 
McMaster29.5%
 
0.0%
 
Other0.1%


SaludaSmith34.3%
 
McMaster65.7%
 
0.0%
 
Other0.1%


SpartanburgSmith38.2%
 
McMaster61.6%
 
0.0%
 
Other0.2%


SumterSmith57.6%
 
McMaster42.3%
 
0.0%
 
Other0.1%


UnionSmith41.7%
 
McMaster58.2%
 
0.0%
 
Other0.1%


WilliamsburgSmith67.2%
 
McMaster32.7%
 
0.0%
 
Other0.1%


YorkSmith41.4%
 
McMaster58.5%
 
0.0%
 
Other0.1%


National DataGraph for 2018 - South Carolina Results for 2018

Login

Terms of Use - DCMA Policy - Privacy Policy and Cookies


© Dave Leip's Atlas of U.S. Elections, LLC 2019 All Rights Reserved