2017 Gubernatorial General Election Data Graphs - Virginia
Note: The Google advertisement links below may advocate political positions that this site does not endorse.
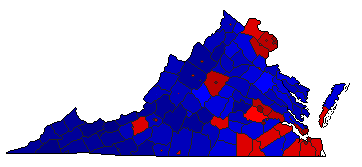
Map

AccomackNortham45.7%
 
Gillespie53.8%
 
Other0.5%


AlbemarleNortham63.7%
 
Gillespie35.1%
 
Other1.1%


AlleghanyNortham33.6%
 
Gillespie65.6%
 
Other0.8%


AmeliaNortham30.4%
 
Gillespie68.7%
 
Other0.9%


AmherstNortham35.6%
 
Gillespie63.4%
 
Other1.0%


AppomattoxNortham23.7%
 
Gillespie75.3%
 
Other1.0%


ArlingtonNortham79.9%
 
Gillespie19.1%
 
Other1.0%


AugustaNortham25.6%
 
Gillespie73.0%
 
Other1.4%


BathNortham30.4%
 
Gillespie68.4%
 
Other1.2%


BedfordNortham25.1%
 
Gillespie74.0%
 
Other0.9%


BlandNortham18.6%
 
Gillespie80.4%
 
Other1.0%


BotetourtNortham27.3%
 
Gillespie71.7%
 
Other1.0%


BrunswickNortham57.3%
 
Gillespie42.3%
 
Other0.4%


BuchananNortham23.4%
 
Gillespie75.9%
 
Other0.7%


BuckinghamNortham41.8%
 
Gillespie57.3%
 
Other0.9%


CampbellNortham25.4%
 
Gillespie73.6%
 
Other1.0%


CarolineNortham49.4%
 
Gillespie49.5%
 
Other1.2%


CarrollNortham22.2%
 
Gillespie76.9%
 
Other0.9%


Charles CityNortham62.6%
 
Gillespie36.8%
 
Other0.6%


CharlotteNortham35.4%
 
Gillespie63.8%
 
Other0.9%


ChesterfieldNortham49.7%
 
Gillespie49.1%
 
Other1.2%


ClarkeNortham43.1%
 
Gillespie55.7%
 
Other1.3%


CraigNortham22.4%
 
Gillespie75.9%
 
Other1.6%


CulpeperNortham36.7%
 
Gillespie62.0%
 
Other1.3%


CumberlandNortham41.2%
 
Gillespie57.7%
 
Other1.1%


DickensonNortham27.8%
 
Gillespie71.4%
 
Other0.8%


DinwiddieNortham44.5%
 
Gillespie54.8%
 
Other0.7%


EssexNortham46.5%
 
Gillespie52.7%
 
Other0.8%


FairfaxNortham67.9%
 
Gillespie31.2%
 
Other1.0%


FauquierNortham39.2%
 
Gillespie59.6%
 
Other1.2%


FloydNortham35.4%
 
Gillespie63.2%
 
Other1.4%


FluvannaNortham46.3%
 
Gillespie52.7%
 
Other1.0%


FranklinNortham30.2%
 
Gillespie68.6%
 
Other1.2%


FrederickNortham34.4%
 
Gillespie64.4%
 
Other1.2%


GilesNortham27.5%
 
Gillespie71.3%
 
Other1.2%


GloucesterNortham34.4%
 
Gillespie64.5%
 
Other1.1%


GoochlandNortham37.1%
 
Gillespie61.9%
 
Other1.0%


GraysonNortham22.7%
 
Gillespie76.7%
 
Other0.7%


GreeneNortham35.2%
 
Gillespie63.4%
 
Other1.4%


GreensvilleNortham56.8%
 
Gillespie42.6%
 
Other0.6%


HalifaxNortham38.8%
 
Gillespie60.4%
 
Other0.8%


HanoverNortham34.2%
 
Gillespie64.4%
 
Other1.4%


HenricoNortham60.8%
 
Gillespie38.0%
 
Other1.1%


HenryNortham34.8%
 
Gillespie64.4%
 
Other0.8%


HighlandNortham30.7%
 
Gillespie67.6%
 
Other1.7%


Isle of WightNortham42.2%
 
Gillespie56.9%
 
Other0.9%


James CityNortham48.9%
 
Gillespie50.1%
 
Other1.0%


King GeorgeNortham37.2%
 
Gillespie61.5%
 
Other1.3%


King and QueenNortham42.0%
 
Gillespie56.8%
 
Other1.1%


King WilliamNortham33.8%
 
Gillespie65.1%
 
Other1.2%


LancasterNortham43.6%
 
Gillespie55.7%
 
Other0.6%


LeeNortham19.5%
 
Gillespie79.2%
 
Other1.3%


LoudounNortham59.4%
 
Gillespie39.5%
 
Other1.1%


LouisaNortham38.0%
 
Gillespie60.6%
 
Other1.4%


LunenburgNortham40.2%
 
Gillespie59.1%
 
Other0.6%


MadisonNortham36.3%
 
Gillespie62.5%
 
Other1.2%


MathewsNortham35.1%
 
Gillespie64.1%
 
Other0.8%


MecklenburgNortham39.7%
 
Gillespie59.9%
 
Other0.4%


MiddlesexNortham37.2%
 
Gillespie61.9%
 
Other0.9%


MontgomeryNortham53.7%
 
Gillespie44.4%
 
Other1.8%


NelsonNortham48.8%
 
Gillespie48.9%
 
Other2.3%


New KentNortham31.9%
 
Gillespie66.8%
 
Other1.3%


NorthamptonNortham56.9%
 
Gillespie42.4%
 
Other0.7%


NorthumberlandNortham37.8%
 
Gillespie61.5%
 
Other0.7%


NottowayNortham42.6%
 
Gillespie56.7%
 
Other0.7%


OrangeNortham38.1%
 
Gillespie61.0%
 
Other0.9%


PageNortham26.9%
 
Gillespie72.1%
 
Other1.0%


PatrickNortham22.4%
 
Gillespie76.7%
 
Other1.0%


PittsylvaniaNortham29.4%
 
Gillespie70.0%
 
Other0.6%


PowhatanNortham27.0%
 
Gillespie71.8%
 
Other1.2%


Prince EdwardNortham51.0%
 
Gillespie47.9%
 
Other1.1%


Prince GeorgeNortham40.3%
 
Gillespie58.7%
 
Other1.1%


Prince WilliamNortham61.1%
 
Gillespie37.9%
 
Other1.1%


PulaskiNortham30.0%
 
Gillespie68.6%
 
Other1.4%


RappahannockNortham45.3%
 
Gillespie53.9%
 
Other0.8%


RichmondNortham36.9%
 
Gillespie62.4%
 
Other0.7%


RoanokeNortham37.5%
 
Gillespie61.2%
 
Other1.3%


RockbridgeNortham37.5%
 
Gillespie61.4%
 
Other1.1%


RockinghamNortham27.9%
 
Gillespie70.8%
 
Other1.3%


RussellNortham22.4%
 
Gillespie76.7%
 
Other0.9%


ScottNortham17.7%
 
Gillespie81.4%
 
Other0.9%


ShenandoahNortham29.5%
 
Gillespie69.3%
 
Other1.2%


SmythNortham22.0%
 
Gillespie76.9%
 
Other1.1%


SouthamptonNortham41.1%
 
Gillespie57.9%
 
Other1.0%


SpotsylvaniaNortham43.1%
 
Gillespie55.7%
 
Other1.2%


StaffordNortham46.8%
 
Gillespie52.0%
 
Other1.3%


SurryNortham56.0%
 
Gillespie42.9%
 
Other1.1%


SussexNortham55.7%
 
Gillespie43.5%
 
Other0.8%


TazewellNortham16.4%
 
Gillespie83.0%
 
Other0.6%


WarrenNortham34.0%
 
Gillespie64.7%
 
Other1.3%


WashingtonNortham24.4%
 
Gillespie74.7%
 
Other0.9%


WestmorelandNortham45.6%
 
Gillespie53.5%
 
Other1.0%


WiseNortham22.1%
 
Gillespie76.8%
 
Other1.0%


WytheNortham24.8%
 
Gillespie74.3%
 
Other0.9%


YorkNortham43.7%
 
Gillespie55.1%
 
Other1.2%


City

AlexandriaNortham78.4%
 
Gillespie20.7%
 
Other0.9%


BristolNortham28.9%
 
Gillespie70.0%
 
Other1.1%


Buena VistaNortham32.0%
 
Gillespie65.9%
 
Other2.2%


CharlottesvilleNortham84.8%
 
Gillespie14.1%
 
Other1.1%


ChesapeakeNortham53.1%
 
Gillespie45.7%
 
Other1.2%


Colonial HeightsNortham26.9%
 
Gillespie71.8%
 
Other1.3%


CovingtonNortham40.6%
 
Gillespie58.4%
 
Other1.0%


DanvilleNortham57.2%
 
Gillespie42.3%
 
Other0.5%


EmporiaNortham55.7%
 
Gillespie43.0%
 
Other1.3%


FairfaxNortham64.8%
 
Gillespie34.0%
 
Other1.2%


Falls ChurchNortham79.0%
 
Gillespie19.7%
 
Other1.3%


FranklinNortham60.2%
 
Gillespie39.2%
 
Other0.6%


FredericksburgNortham64.4%
 
Gillespie34.1%
 
Other1.5%


GalaxNortham30.2%
 
Gillespie68.6%
 
Other1.2%


HamptonNortham71.6%
 
Gillespie27.4%
 
Other1.0%


HarrisonburgNortham63.6%
 
Gillespie34.9%
 
Other1.6%


HopewellNortham50.0%
 
Gillespie48.4%
 
Other1.6%


LexingtonNortham66.5%
 
Gillespie32.7%
 
Other0.8%


LynchburgNortham47.2%
 
Gillespie51.4%
 
Other1.4%


ManassasNortham56.9%
 
Gillespie41.9%
 
Other1.3%


Manassas ParkNortham63.7%
 
Gillespie34.6%
 
Other1.8%


MartinsvilleNortham58.6%
 
Gillespie39.9%
 
Other1.6%


Newport NewsNortham64.7%
 
Gillespie34.0%
 
Other1.3%


NorfolkNortham73.5%
 
Gillespie25.1%
 
Other1.3%


NortonNortham33.4%
 
Gillespie65.2%
 
Other1.4%


PetersburgNortham87.7%
 
Gillespie11.5%
 
Other0.8%


PoquosonNortham26.9%
 
Gillespie71.9%
 
Other1.2%


PortsmouthNortham70.2%
 
Gillespie28.4%
 
Other1.3%


RadfordNortham54.9%
 
Gillespie43.3%
 
Other1.8%


RichmondNortham81.5%
 
Gillespie17.2%
 
Other1.3%


RoanokeNortham62.0%
 
Gillespie36.5%
 
Other1.5%


SalemNortham38.2%
 
Gillespie60.3%
 
Other1.4%


StauntonNortham53.3%
 
Gillespie44.9%
 
Other1.8%


SuffolkNortham58.3%
 
Gillespie40.7%
 
Other1.0%


Virginia BeachNortham51.9%
 
Gillespie46.9%
 
Other1.3%


WaynesboroNortham45.0%
 
Gillespie53.3%
 
Other1.7%


WilliamsburgNortham70.6%
 
Gillespie28.3%
 
Other1.1%


WinchesterNortham53.7%
 
Gillespie44.7%
 
Other1.7%


National DataGraph for 2017 - Virginia Results for 2017

Login

Terms of Use - DCMA Policy - Privacy Policy and Cookies


© Dave Leip's Atlas of U.S. Elections, LLC 2019 All Rights Reserved