2008 Presidential General Election Data Graphs - Wyoming
Note: The Google advertisement links below may advocate political positions that this site does not endorse.
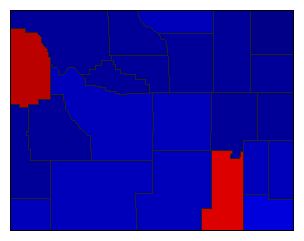
Map

AlbanyObama50.5%
 
McCain46.4%
 
Other3.1%


Big HornObama20.9%
 
McCain76.2%
 
Other3.0%


CampbellObama18.3%
 
McCain79.7%
 
Other2.0%


CarbonObama34.1%
 
McCain63.2%
 
Other2.7%


ConverseObama21.4%
 
McCain76.3%
 
Other2.3%


CrookObama16.6%
 
McCain80.6%
 
Other2.8%


FremontObama34.2%
 
McCain63.0%
 
Other2.8%


GoshenObama31.0%
 
McCain66.7%
 
Other2.3%


Hot SpringsObama24.3%
 
McCain72.0%
 
Other3.7%


JohnsonObama20.9%
 
McCain76.6%
 
Other2.6%


LaramieObama38.6%
 
McCain59.0%
 
Other2.4%


LincolnObama21.3%
 
McCain75.7%
 
Other3.0%


NatronaObama31.5%
 
McCain65.8%
 
Other2.7%


NiobraraObama18.9%
 
McCain78.7%
 
Other2.5%


ParkObama25.1%
 
McCain72.3%
 
Other2.6%


PlatteObama30.9%
 
McCain65.8%
 
Other3.3%


SheridanObama29.8%
 
McCain67.9%
 
Other2.3%


SubletteObama21.5%
 
McCain76.1%
 
Other2.4%


SweetwaterObama34.5%
 
McCain62.0%
 
Other3.5%


TetonObama60.7%
 
McCain37.1%
 
Other2.3%


UintaObama27.6%
 
McCain68.7%
 
Other3.6%


WashakieObama25.5%
 
McCain72.3%
 
Other2.2%


WestonObama19.4%
 
McCain77.2%
 
Other3.4%


National DataGraph for 2008 - Wyoming Results for 2008

Login

Terms of Use - DCMA Policy - Privacy Policy and Cookies


© Dave Leip's Atlas of U.S. Elections, LLC 2019 All Rights Reserved