1992 Presidential Democratic Primary Election Data Graphs - California
Note: The Google advertisement links below may advocate political positions that this site does not endorse.
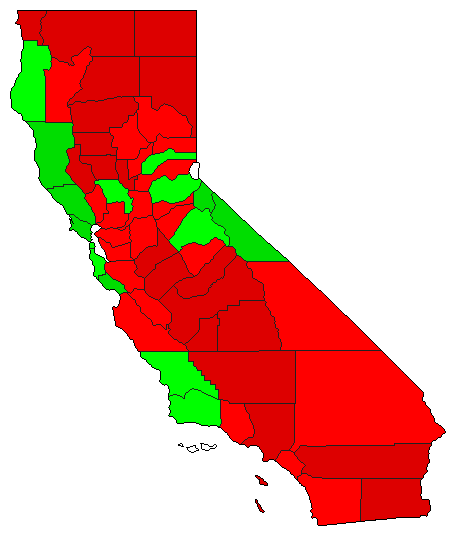
Map

AlamedaClinton45.1%
 
Tsongas6.6%
 
Brown43.9%
 
Other4.3%


AlpineClinton32.2%
 
Tsongas6.0%
 
Brown56.4%
 
Other5.4%


AmadorClinton49.4%
 
Tsongas8.2%
 
Brown37.1%
 
Other5.4%


ButteClinton48.0%
 
Tsongas9.1%
 
Brown36.9%
 
Other6.0%


CalaverasClinton43.5%
 
Tsongas8.0%
 
Brown41.4%
 
Other7.1%


ColusaClinton52.3%
 
Tsongas8.4%
 
Brown31.0%
 
Other8.3%


Contra CostaClinton48.4%
 
Tsongas7.9%
 
Brown40.2%
 
Other3.5%


Del NorteClinton53.6%
 
Tsongas8.7%
 
Brown33.1%
 
Other4.5%


El DoradoClinton39.9%
 
Tsongas10.5%
 
Brown43.4%
 
Other6.1%


FresnoClinton55.4%
 
Tsongas8.3%
 
Brown30.6%
 
Other5.7%


GlennClinton55.3%
 
Tsongas10.3%
 
Brown26.4%
 
Other8.0%


HumboldtClinton39.7%
 
Tsongas9.9%
 
Brown44.2%
 
Other6.2%


ImperialClinton50.5%
 
Tsongas6.1%
 
Brown34.2%
 
Other9.2%


InyoClinton46.1%
 
Tsongas9.5%
 
Brown35.4%
 
Other9.0%


KernClinton55.9%
 
Tsongas7.6%
 
Brown30.1%
 
Other6.4%


KingsClinton57.4%
 
Tsongas6.9%
 
Brown30.0%
 
Other5.7%


LakeClinton52.0%
 
Tsongas6.4%
 
Brown37.3%
 
Other4.3%


LassenClinton50.0%
 
Tsongas9.6%
 
Brown32.0%
 
Other8.4%


Los AngelesClinton51.1%
 
Tsongas6.1%
 
Brown38.1%
 
Other4.8%


MaderaClinton55.2%
 
Tsongas8.0%
 
Brown28.5%
 
Other8.3%


MarinClinton36.6%
 
Tsongas7.6%
 
Brown52.6%
 
Other3.3%


MariposaClinton48.2%
 
Tsongas10.0%
 
Brown35.5%
 
Other6.3%


MendocinoClinton36.0%
 
Tsongas6.9%
 
Brown52.4%
 
Other4.7%


MercedClinton53.9%
 
Tsongas8.8%
 
Brown32.1%
 
Other5.2%


ModocClinton54.9%
 
Tsongas9.0%
 
Brown26.3%
 
Other9.8%


MonoClinton32.8%
 
Tsongas9.4%
 
Brown53.4%
 
Other4.4%


MontereyClinton44.6%
 
Tsongas8.7%
 
Brown41.8%
 
Other4.9%


NapaClinton46.4%
 
Tsongas8.2%
 
Brown40.8%
 
Other4.7%


NevadaClinton40.5%
 
Tsongas9.0%
 
Brown45.0%
 
Other5.5%


OrangeClinton45.8%
 
Tsongas8.2%
 
Brown39.1%
 
Other6.8%


PlacerClinton43.0%
 
Tsongas9.9%
 
Brown41.6%
 
Other5.5%


PlumasClinton47.1%
 
Tsongas9.6%
 
Brown36.3%
 
Other7.0%


RiversideClinton56.0%
 
Tsongas6.2%
 
Brown33.0%
 
Other4.8%


SacramentoClinton44.6%
 
Tsongas9.3%
 
Brown40.0%
 
Other6.1%


San BenitoClinton46.4%
 
Tsongas9.6%
 
Brown38.6%
 
Other5.3%


San BernardinoClinton49.6%
 
Tsongas7.0%
 
Brown37.0%
 
Other6.3%


San DiegoClinton47.3%
 
Tsongas8.5%
 
Brown38.8%
 
Other5.4%


San FranciscoClinton41.4%
 
Tsongas5.8%
 
Brown49.8%
 
Other3.0%


San JoaquinClinton49.6%
 
Tsongas6.4%
 
Brown38.4%
 
Other5.5%


San Luis ObispoClinton37.8%
 
Tsongas9.6%
 
Brown48.0%
 
Other4.6%


San MateoClinton41.4%
 
Tsongas8.4%
 
Brown46.5%
 
Other3.7%


Santa BarbaraClinton42.1%
 
Tsongas9.5%
 
Brown43.5%
 
Other5.0%


Santa ClaraClinton44.1%
 
Tsongas9.6%
 
Brown42.4%
 
Other3.9%


Santa CruzClinton34.4%
 
Tsongas6.9%
 
Brown54.1%
 
Other4.7%


ShastaClinton53.5%
 
Tsongas10.3%
 
Brown29.6%
 
Other6.7%


SierraClinton41.1%
 
Tsongas9.8%
 
Brown40.3%
 
Other8.8%


SiskiyouClinton50.6%
 
Tsongas8.7%
 
Brown35.3%
 
Other5.5%


SolanoClinton45.2%
 
Tsongas8.1%
 
Brown41.2%
 
Other5.4%


SonomaClinton39.1%
 
Tsongas6.6%
 
Brown50.8%
 
Other3.5%


StanislausClinton53.7%
 
Tsongas7.0%
 
Brown33.9%
 
Other5.5%


SutterClinton52.1%
 
Tsongas9.5%
 
Brown32.2%
 
Other6.2%


TehamaClinton56.6%
 
Tsongas8.1%
 
Brown29.3%
 
Other6.0%


TrinityClinton47.6%
 
Tsongas8.4%
 
Brown36.7%
 
Other7.3%


TulareClinton55.9%
 
Tsongas7.8%
 
Brown30.0%
 
Other6.3%


TuolumneClinton42.7%
 
Tsongas7.9%
 
Brown43.3%
 
Other6.1%


VenturaClinton46.2%
 
Tsongas8.3%
 
Brown40.4%
 
Other5.1%


YoloClinton42.8%
 
Tsongas9.7%
 
Brown42.9%
 
Other4.6%


YubaClinton49.9%
 
Tsongas7.6%
 
Brown34.4%
 
Other8.1%


National DataGraph for 1992 - California Results for 1992

Login

Terms of Use - DCMA Policy - Privacy Policy and Cookies


© Dave Leip's Atlas of U.S. Elections, LLC 2019 All Rights Reserved