2018 Gubernatorial General Election Data Graphs - California
Note: The Google advertisement links below may advocate political positions that this site does not endorse.
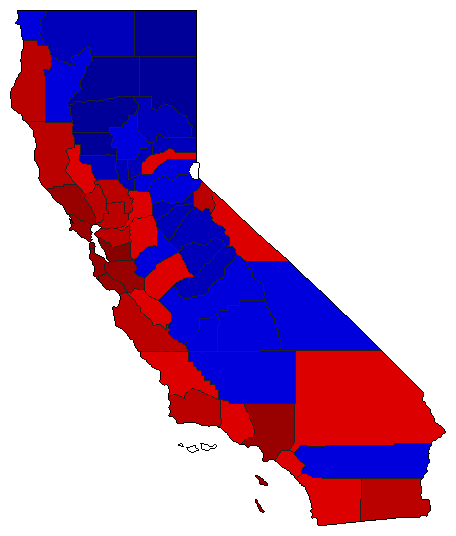
Map

AlamedaNewsom80.6%
 
Cox19.4%
 
0.0%


AlpineNewsom62.8%
 
Cox37.2%
 
0.0%


AmadorNewsom35.5%
 
Cox64.5%
 
0.0%


ButteNewsom46.8%
 
Cox53.2%
 
0.0%


CalaverasNewsom35.9%
 
Cox64.1%
 
0.0%


ColusaNewsom34.7%
 
Cox65.3%
 
0.0%


Contra CostaNewsom68.2%
 
Cox31.8%
 
0.0%


Del NorteNewsom41.3%
 
Cox58.7%
 
0.0%


El DoradoNewsom40.6%
 
Cox59.4%
 
0.0%


FresnoNewsom49.1%
 
Cox50.9%
 
0.0%


GlennNewsom29.1%
 
Cox70.9%
 
0.0%


HumboldtNewsom64.5%
 
Cox35.5%
 
0.0%


ImperialNewsom61.7%
 
Cox38.3%
 
0.0%


InyoNewsom44.7%
 
Cox55.3%
 
0.0%


KernNewsom41.1%
 
Cox58.9%
 
0.0%


KingsNewsom40.6%
 
Cox59.4%
 
0.0%


LakeNewsom51.4%
 
Cox48.6%
 
0.0%


LassenNewsom22.7%
 
Cox77.3%
 
0.0%


Los AngelesNewsom71.9%
 
Cox28.1%
 
0.0%


MaderaNewsom39.0%
 
Cox61.0%
 
0.0%


MarinNewsom79.5%
 
Cox20.5%
 
0.0%


MariposaNewsom38.7%
 
Cox61.3%
 
0.0%


MendocinoNewsom66.3%
 
Cox33.7%
 
0.0%


MercedNewsom52.0%
 
Cox48.0%
 
0.0%


ModocNewsom23.8%
 
Cox76.2%
 
0.0%


MonoNewsom55.8%
 
Cox44.2%
 
0.0%


MontereyNewsom66.0%
 
Cox34.0%
 
0.0%


NapaNewsom64.8%
 
Cox35.2%
 
0.0%


NevadaNewsom52.9%
 
Cox47.1%
 
0.0%


OrangeNewsom50.1%
 
Cox49.9%
 
0.0%


PlacerNewsom41.2%
 
Cox58.8%
 
0.0%


PlumasNewsom37.2%
 
Cox62.8%
 
0.0%


RiversideNewsom49.8%
 
Cox50.2%
 
0.0%


SacramentoNewsom58.8%
 
Cox41.2%
 
0.0%


San BenitoNewsom56.1%
 
Cox43.9%
 
0.0%


San BernardinoNewsom51.5%
 
Cox48.5%
 
0.0%


San DiegoNewsom56.9%
 
Cox43.1%
 
0.0%


San FranciscoNewsom86.4%
 
Cox13.6%
 
0.0%


San JoaquinNewsom52.2%
 
Cox47.8%
 
0.0%


San Luis ObispoNewsom51.6%
 
Cox48.4%
 
0.0%


San MateoNewsom75.2%
 
Cox24.8%
 
0.0%


Santa BarbaraNewsom60.5%
 
Cox39.5%
 
0.0%


Santa ClaraNewsom71.4%
 
Cox28.6%
 
0.0%


Santa CruzNewsom76.8%
 
Cox23.2%
 
0.0%


ShastaNewsom28.9%
 
Cox71.1%
 
0.0%


SierraNewsom35.9%
 
Cox64.1%
 
0.0%


SiskiyouNewsom39.7%
 
Cox60.3%
 
0.0%


SolanoNewsom61.3%
 
Cox38.7%
 
0.0%


SonomaNewsom72.3%
 
Cox27.7%
 
0.0%


StanislausNewsom49.2%
 
Cox50.8%
 
0.0%


SutterNewsom37.0%
 
Cox63.0%
 
0.0%


TehamaNewsom27.5%
 
Cox72.5%
 
0.0%


TrinityNewsom42.3%
 
Cox57.7%
 
0.0%


TulareNewsom42.8%
 
Cox57.2%
 
0.0%


TuolumneNewsom38.9%
 
Cox61.1%
 
0.0%


VenturaNewsom55.6%
 
Cox44.4%
 
0.0%


YoloNewsom67.8%
 
Cox32.2%
 
0.0%


YubaNewsom36.0%
 
Cox64.0%
 
0.0%


National DataGraph for 2018 - California Results for 2018

Login

Terms of Use - DCMA Policy - Privacy Policy and Cookies


© Dave Leip's Atlas of U.S. Elections, LLC 2019 All Rights Reserved