1960 Senatorial General Election Data Graphs - Michigan
Note: The Google advertisement links below may advocate political positions that this site does not endorse.
Data for this Contest was Contributed by on 2012-11-03
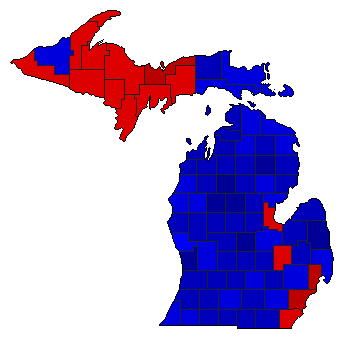
Map

AlconaMcNamara33.0%
 
Bentley66.8%
 
Other0.2%


AlgerMcNamara60.4%
 
Bentley39.3%
 
Other0.3%


AlleganMcNamara30.9%
 
Bentley69.0%
 
Other0.2%


AlpenaMcNamara42.9%
 
Bentley57.0%
 
Other0.1%


AntrimMcNamara33.7%
 
Bentley66.2%
 
Other0.1%


ArenacMcNamara43.7%
 
Bentley56.1%
 
Other0.2%


BaragaMcNamara54.1%
 
Bentley45.6%
 
Other0.2%


BarryMcNamara34.2%
 
Bentley65.3%
 
Other0.5%


BayMcNamara52.6%
 
Bentley47.2%
 
Other0.2%


BenzieMcNamara35.1%
 
Bentley64.5%
 
Other0.3%


BerrienMcNamara40.2%
 
Bentley59.5%
 
Other0.3%


BranchMcNamara37.5%
 
Bentley62.0%
 
Other0.5%


CalhounMcNamara44.6%
 
Bentley55.1%
 
Other0.3%


CassMcNamara44.3%
 
Bentley55.3%
 
Other0.4%


CharlevoixMcNamara39.4%
 
Bentley60.3%
 
Other0.3%


CheboyganMcNamara43.3%
 
Bentley56.6%
 
Other0.1%


ChippewaMcNamara46.1%
 
Bentley53.7%
 
Other0.1%


ClareMcNamara29.4%
 
Bentley70.3%
 
Other0.2%


ClintonMcNamara31.5%
 
Bentley68.3%
 
Other0.1%


CrawfordMcNamara36.0%
 
Bentley63.9%
 
Other0.1%


DeltaMcNamara58.6%
 
Bentley41.2%
 
Other0.1%


DickinsonMcNamara56.1%
 
Bentley43.8%
 
Other0.1%


EatonMcNamara36.3%
 
Bentley63.4%
 
Other0.3%


EmmetMcNamara36.9%
 
Bentley62.9%
 
Other0.2%


GeneseeMcNamara50.9%
 
Bentley48.9%
 
Other0.3%


GladwinMcNamara31.5%
 
Bentley68.3%
 
Other0.2%


GogebicMcNamara59.5%
 
Bentley40.3%
 
Other0.2%


Grand TraverseMcNamara36.7%
 
Bentley63.0%
 
Other0.2%


GratiotMcNamara27.4%
 
Bentley72.4%
 
Other0.2%


HillsdaleMcNamara30.5%
 
Bentley68.9%
 
Other0.6%


HoughtonMcNamara52.1%
 
Bentley47.8%
 
Other0.2%


HuronMcNamara36.4%
 
Bentley63.6%
 
Other0.1%


InghamMcNamara40.1%
 
Bentley59.7%
 
Other0.2%


IoniaMcNamara36.2%
 
Bentley63.5%
 
Other0.3%


IoscoMcNamara37.1%
 
Bentley62.8%
 
Other0.1%


IronMcNamara58.1%
 
Bentley41.7%
 
Other0.2%


IsabellaMcNamara35.8%
 
Bentley64.0%
 
Other0.1%


JacksonMcNamara39.5%
 
Bentley60.3%
 
Other0.2%


KalamazooMcNamara38.1%
 
Bentley61.5%
 
Other0.4%


KalkaskaMcNamara36.3%
 
Bentley63.6%
 
Other0.1%


KentMcNamara40.4%
 
Bentley59.4%
 
Other0.2%


KeweenawMcNamara50.9%
 
Bentley48.9%
 
Other0.2%


LakeMcNamara47.4%
 
Bentley52.4%
 
Other0.1%


LapeerMcNamara33.3%
 
Bentley66.5%
 
Other0.1%


LeelanauMcNamara39.2%
 
Bentley60.7%
 
Other0.1%


LenaweeMcNamara36.0%
 
Bentley63.8%
 
Other0.2%


LivingstonMcNamara36.5%
 
Bentley63.3%
 
Other0.2%


LuceMcNamara36.6%
 
Bentley63.3%
 
Other0.1%


MackinacMcNamara41.2%
 
Bentley58.6%
 
Other0.2%


MacombMcNamara63.8%
 
Bentley35.9%
 
Other0.2%


ManisteeMcNamara45.5%
 
Bentley54.4%
 
Other0.1%


MarquetteMcNamara53.9%
 
Bentley45.9%
 
Other0.2%


MasonMcNamara44.2%
 
Bentley55.6%
 
Other0.2%


MecostaMcNamara31.6%
 
Bentley68.1%
 
Other0.3%


MenomineeMcNamara53.2%
 
Bentley46.6%
 
Other0.2%


MidlandMcNamara33.3%
 
Bentley66.6%
 
Other0.1%


MissaukeeMcNamara21.0%
 
Bentley78.7%
 
Other0.3%


MonroeMcNamara52.8%
 
Bentley47.0%
 
Other0.2%


MontcalmMcNamara31.4%
 
Bentley68.4%
 
Other0.2%


MontmorencyMcNamara35.8%
 
Bentley64.1%
 
Other0.1%


MuskegonMcNamara49.8%
 
Bentley50.0%
 
Other0.2%


NewaygoMcNamara32.7%
 
Bentley67.1%
 
Other0.1%


OaklandMcNamara45.9%
 
Bentley53.8%
 
Other0.3%


OceanaMcNamara38.5%
 
Bentley61.3%
 
Other0.2%


OgemawMcNamara41.5%
 
Bentley58.3%
 
Other0.2%


OntonagonMcNamara49.5%
 
Bentley50.4%
 
Other0.0%


OsceolaMcNamara24.5%
 
Bentley75.2%
 
Other0.3%


OscodaMcNamara28.4%
 
Bentley71.4%
 
Other0.2%


OtsegoMcNamara44.6%
 
Bentley55.4%
 
Other0.1%


OttawaMcNamara27.2%
 
Bentley72.6%
 
Other0.2%


Presque IsleMcNamara47.3%
 
Bentley52.5%
 
Other0.1%


RoscommonMcNamara31.4%
 
Bentley68.5%
 
Other0.2%


SaginawMcNamara42.2%
 
Bentley57.6%
 
Other0.3%


St. ClairMcNamara41.7%
 
Bentley58.1%
 
Other0.2%


St. JosephMcNamara31.9%
 
Bentley67.7%
 
Other0.4%


SanilacMcNamara27.9%
 
Bentley72.0%
 
Other0.1%


SchoolcraftMcNamara53.4%
 
Bentley46.5%
 
Other0.1%


ShiawasseeMcNamara35.8%
 
Bentley64.0%
 
Other0.3%


TuscolaMcNamara31.2%
 
Bentley68.6%
 
Other0.2%


Van BurenMcNamara36.6%
 
Bentley63.1%
 
Other0.4%


WashtenawMcNamara39.9%
 
Bentley59.8%
 
Other0.3%


WayneMcNamara66.2%
 
Bentley33.5%
 
Other0.3%


WexfordMcNamara37.5%
 
Bentley62.3%
 
Other0.3%


National DataGraph for 1960 - Michigan Results for 1960

Login

Terms of Use - DCMA Policy - Privacy Policy and Cookies


© Dave Leip's Atlas of U.S. Elections, LLC 2019 All Rights Reserved