1964 Senatorial General Election Data Graphs - New York
Note: The Google advertisement links below may advocate political positions that this site does not endorse.
Data for this Contest was Contributed by on 2014-05-04
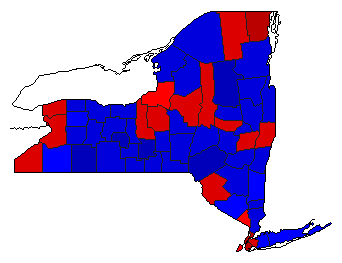
Map

AlbanyKennedy58.8%
 
Keating40.4%
 
Other0.9%


AlleganyKennedy35.8%
 
Keating63.7%
 
Other0.5%


BronxKennedy64.8%
 
Keating30.7%
 
Other4.4%


BroomeKennedy46.4%
 
Keating52.8%
 
Other0.9%


CattaraugusKennedy49.4%
 
Keating49.9%
 
Other0.7%


CayugaKennedy52.2%
 
Keating46.4%
 
Other1.4%


ChautauquaKennedy52.0%
 
Keating47.5%
 
Other0.6%


ChemungKennedy47.0%
 
Keating52.4%
 
Other0.6%


ChenangoKennedy42.4%
 
Keating56.7%
 
Other0.9%


ClintonKennedy61.5%
 
Keating38.1%
 
Other0.3%


ColumbiaKennedy45.1%
 
Keating52.9%
 
Other2.0%


CortlandKennedy44.6%
 
Keating54.8%
 
Other0.6%


DelawareKennedy36.6%
 
Keating62.6%
 
Other0.8%


DutchessKennedy48.0%
 
Keating49.3%
 
Other2.7%


ErieKennedy58.3%
 
Keating40.8%
 
Other0.9%


EssexKennedy48.3%
 
Keating51.0%
 
Other0.7%


FranklinKennedy57.6%
 
Keating41.8%
 
Other0.6%


FultonKennedy47.6%
 
Keating51.4%
 
Other1.0%


GeneseeKennedy49.4%
 
Keating50.0%
 
Other0.6%


GreeneKennedy43.1%
 
Keating54.8%
 
Other2.1%


HamiltonKennedy36.7%
 
Keating62.4%
 
Other0.9%


HerkimerKennedy56.8%
 
Keating42.6%
 
Other0.7%


JeffersonKennedy47.1%
 
Keating52.4%
 
Other0.4%


KingsKennedy62.6%
 
Keating33.5%
 
Other3.9%


LewisKennedy46.8%
 
Keating52.6%
 
Other0.6%


LivingstonKennedy42.4%
 
Keating57.0%
 
Other0.6%


MadisonKennedy45.9%
 
Keating52.0%
 
Other2.2%


MonroeKennedy43.8%
 
Keating55.4%
 
Other0.8%


MontgomeryKennedy54.9%
 
Keating44.0%
 
Other1.1%


NassauKennedy45.3%
 
Keating49.8%
 
Other4.9%


New YorkKennedy61.8%
 
Keating35.6%
 
Other2.6%


NiagaraKennedy55.4%
 
Keating44.0%
 
Other0.6%


OneidaKennedy58.4%
 
Keating40.6%
 
Other1.1%


OnondagaKennedy55.6%
 
Keating42.6%
 
Other1.8%


OntarioKennedy41.8%
 
Keating57.4%
 
Other0.7%


OrangeKennedy48.5%
 
Keating48.8%
 
Other2.7%


OrleansKennedy43.0%
 
Keating56.7%
 
Other0.3%


OswegoKennedy49.7%
 
Keating49.4%
 
Other0.9%


OtsegoKennedy41.2%
 
Keating58.2%
 
Other0.6%


PutnamKennedy45.7%
 
Keating50.6%
 
Other3.6%


QueensKennedy53.4%
 
Keating41.2%
 
Other5.4%


RensselaerKennedy52.2%
 
Keating46.7%
 
Other1.1%


RichmondKennedy46.7%
 
Keating45.1%
 
Other8.2%


RocklandKennedy48.2%
 
Keating47.0%
 
Other4.9%


St. LawrenceKennedy49.3%
 
Keating50.2%
 
Other0.5%


SaratogaKennedy48.1%
 
Keating50.4%
 
Other1.5%


SchenectadyKennedy48.7%
 
Keating50.1%
 
Other1.2%


SchoharieKennedy44.5%
 
Keating54.5%
 
Other1.1%


SchuylerKennedy41.8%
 
Keating57.2%
 
Other1.0%


SenecaKennedy48.5%
 
Keating50.8%
 
Other0.8%


SteubenKennedy40.9%
 
Keating58.6%
 
Other0.5%


SuffolkKennedy46.6%
 
Keating48.4%
 
Other5.0%


SullivanKennedy50.7%
 
Keating47.7%
 
Other1.6%


TiogaKennedy39.2%
 
Keating59.6%
 
Other1.2%


TompkinsKennedy38.1%
 
Keating60.7%
 
Other1.2%


UlsterKennedy46.9%
 
Keating50.2%
 
Other2.8%


WarrenKennedy44.3%
 
Keating54.7%
 
Other1.0%


WashingtonKennedy45.0%
 
Keating54.1%
 
Other0.9%


WayneKennedy39.7%
 
Keating59.5%
 
Other0.8%


WestchesterKennedy44.5%
 
Keating51.5%
 
Other3.9%


WyomingKennedy41.9%
 
Keating57.6%
 
Other0.5%


YatesKennedy33.4%
 
Keating65.8%
 
Other0.8%


National DataGraph for 1964 - New York Results for 1964

Login

Terms of Use - DCMA Policy - Privacy Policy and Cookies


© Dave Leip's Atlas of U.S. Elections, LLC 2019 All Rights Reserved