1968 Attorney General General Election Data Graphs - Illinois
Note: The Google advertisement links below may advocate political positions that this site does not endorse.
Data for this Contest was Contributed by on 2018-10-28
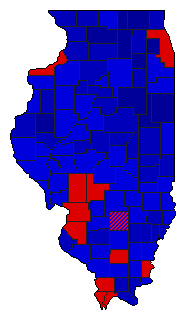
Map

AdamsLorenz41.4%
 
Scott58.4%
 
Other0.1%


AlexanderLorenz51.0%
 
Scott48.7%
 
Other0.3%


BondLorenz44.7%
 
Scott55.1%
 
Other0.2%


BooneLorenz29.4%
 
Scott70.5%
 
Other0.1%


BrownLorenz46.1%
 
Scott53.2%
 
Other0.7%


BureauLorenz35.3%
 
Scott64.6%
 
Other0.1%


CalhounLorenz46.8%
 
Scott53.1%
 
Other0.2%


CarrollLorenz31.1%
 
Scott68.8%
 
Other0.1%


CassLorenz48.7%
 
Scott51.2%
 
Other0.0%


ChampaignLorenz31.2%
 
Scott68.5%
 
Other0.3%


ChristianLorenz49.2%
 
Scott50.7%
 
Other0.1%


ClarkLorenz40.3%
 
Scott59.6%
 
Other0.0%


ClayLorenz41.7%
 
Scott58.3%
 
Other0.1%


ClintonLorenz43.0%
 
Scott57.0%
 
Other0.0%


ColesLorenz39.8%
 
Scott60.1%
 
Other0.1%


CookLorenz53.8%
 
Scott45.8%
 
Other0.4%


CrawfordLorenz40.1%
 
Scott59.8%
 
Other0.1%


CumberlandLorenz43.1%
 
Scott56.6%
 
Other0.3%


DeKalbLorenz28.2%
 
Scott70.4%
 
Other1.4%


De WittLorenz34.5%
 
Scott65.4%
 
Other0.1%


DouglasLorenz33.9%
 
Scott66.0%
 
Other0.1%


DuPageLorenz27.8%
 
Scott72.0%
 
Other0.2%


EdgarLorenz38.0%
 
Scott61.9%
 
Other0.1%


EdwardsLorenz32.7%
 
Scott67.3%
 
Other0.1%


EffinghamLorenz44.9%
 
Scott55.0%
 
Other0.0%


FayetteLorenz44.8%
 
Scott55.2%
 
Other0.0%


FordLorenz27.8%
 
Scott72.2%
 
Other0.1%


FranklinLorenz53.1%
 
Scott46.9%
 
Other0.1%


FultonLorenz47.4%
 
Scott52.3%
 
Other0.3%


GallatinLorenz53.3%
 
Scott46.6%
 
Other0.1%


GreeneLorenz44.0%
 
Scott55.9%
 
Other0.1%


GrundyLorenz33.5%
 
Scott66.5%
 
Other0.1%


HamiltonLorenz44.1%
 
Scott55.8%
 
Other0.0%


HancockLorenz36.8%
 
Scott63.1%
 
Other0.0%


HardinLorenz45.5%
 
Scott54.3%
 
Other0.3%


HendersonLorenz40.0%
 
Scott59.8%
 
Other0.2%


HenryLorenz41.6%
 
Scott58.3%
 
Other0.1%


IroquoisLorenz25.6%
 
Scott74.2%
 
Other0.2%


JacksonLorenz45.3%
 
Scott54.4%
 
Other0.3%


JasperLorenz46.4%
 
Scott53.4%
 
Other0.1%


JeffersonLorenz48.5%
 
Scott51.4%
 
Other0.1%


JerseyLorenz46.5%
 
Scott53.4%
 
Other0.1%


Jo DaviessLorenz35.9%
 
Scott64.0%
 
Other0.1%


JohnsonLorenz32.9%
 
Scott66.9%
 
Other0.2%


KaneLorenz30.6%
 
Scott68.9%
 
Other0.5%


KankakeeLorenz41.3%
 
Scott58.6%
 
Other0.1%


KendallLorenz23.3%
 
Scott76.6%
 
Other0.1%


KnoxLorenz40.0%
 
Scott59.6%
 
Other0.4%


LakeLorenz34.6%
 
Scott64.1%
 
Other1.2%


LaSalleLorenz45.4%
 
Scott54.6%
 
Other0.1%


LawrenceLorenz41.5%
 
Scott58.4%
 
Other0.1%


LeeLorenz32.2%
 
Scott67.8%
 
Other0.1%


LivingstonLorenz28.2%
 
Scott71.8%
 
Other0.1%


LoganLorenz33.5%
 
Scott66.4%
 
Other0.0%


McDonoughLorenz29.8%
 
Scott70.1%
 
Other0.1%


McHenryLorenz26.8%
 
Scott72.1%
 
Other1.1%


McLeanLorenz30.8%
 
Scott68.4%
 
Other0.8%


MaconLorenz44.4%
 
Scott55.0%
 
Other0.5%


MacoupinLorenz51.7%
 
Scott48.2%
 
Other0.1%


MadisonLorenz51.5%
 
Scott48.4%
 
Other0.1%


MarionLorenz49.7%
 
Scott49.7%
 
Other0.7%


MarshallLorenz38.2%
 
Scott61.6%
 
Other0.2%


MasonLorenz45.0%
 
Scott54.9%
 
Other0.2%


MassacLorenz35.4%
 
Scott64.4%
 
Other0.2%


MenardLorenz36.8%
 
Scott63.1%
 
Other0.0%


MercerLorenz40.1%
 
Scott59.8%
 
Other0.1%


MonroeLorenz39.6%
 
Scott60.3%
 
Other0.1%


MontgomeryLorenz50.1%
 
Scott49.9%
 
Other0.1%


MorganLorenz41.2%
 
Scott58.7%
 
Other0.1%


MoultrieLorenz41.0%
 
Scott58.9%
 
Other0.1%


OgleLorenz24.6%
 
Scott75.4%
 
Other0.1%


PeoriaLorenz42.5%
 
Scott56.6%
 
Other0.9%


PerryLorenz47.1%
 
Scott52.8%
 
Other0.1%


PiattLorenz33.6%
 
Scott66.3%
 
Other0.0%


PikeLorenz46.8%
 
Scott53.1%
 
Other0.1%


PopeLorenz35.9%
 
Scott64.1%


PulaskiLorenz51.8%
 
Scott48.2%


PutnamLorenz41.1%
 
Scott58.8%
 
Other0.1%


RandolphLorenz46.2%
 
Scott53.8%
 
Other0.1%


RichlandLorenz39.5%
 
Scott60.4%
 
Other0.1%


Rock IslandLorenz51.9%
 
Scott47.8%
 
Other0.3%


St. ClairLorenz55.9%
 
Scott43.4%
 
Other0.6%


SalineLorenz47.8%
 
Scott52.1%
 
Other0.1%


SangamonLorenz41.4%
 
Scott57.9%
 
Other0.7%


SchuylerLorenz38.0%
 
Scott61.6%
 
Other0.4%


ScottLorenz40.9%
 
Scott59.1%
 
Other0.0%


ShelbyLorenz42.9%
 
Scott57.0%
 
Other0.1%


StarkLorenz32.4%
 
Scott67.5%
 
Other0.1%


StephensonLorenz33.3%
 
Scott66.6%
 
Other0.1%


TazewellLorenz43.4%
 
Scott56.5%
 
Other0.1%


UnionLorenz50.5%
 
Scott49.4%
 
Other0.1%


VermilionLorenz40.2%
 
Scott59.7%
 
Other0.1%


WabashLorenz39.3%
 
Scott60.5%
 
Other0.2%


WarrenLorenz35.2%
 
Scott64.7%
 
Other0.1%


WashingtonLorenz31.9%
 
Scott68.0%
 
Other0.1%


WayneLorenz38.8%
 
Scott61.1%
 
Other0.1%


WhiteLorenz43.8%
 
Scott56.1%
 
Other0.1%


WhitesideLorenz34.7%
 
Scott65.1%
 
Other0.2%


WillLorenz41.0%
 
Scott58.0%
 
Other1.0%


WilliamsonLorenz43.9%
 
Scott56.0%
 
Other0.1%


WinnebagoLorenz40.5%
 
Scott59.4%
 
Other0.1%


WoodfordLorenz32.1%
 
Scott67.7%
 
Other0.2%


National DataGraph for 1968 - Illinois Results for 1968

Login

Terms of Use - DCMA Policy - Privacy Policy and Cookies


© Dave Leip's Atlas of U.S. Elections, LLC 2019 All Rights Reserved