1968 Presidential General Election Data Graphs - Michigan
Note: The Google advertisement links below may advocate political positions that this site does not endorse.
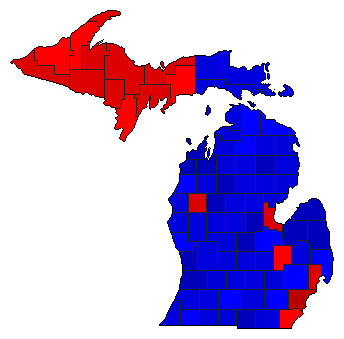
Map

AlconaHumphrey30.4%
 
Nixon58.8%
 
Wallace10.7%
 
Other0.1%


AlgerHumphrey54.9%
 
Nixon40.0%
 
Wallace4.9%
 
Other0.2%


AlleganHumphrey29.7%
 
Nixon60.3%
 
Wallace9.8%
 
Other0.2%


AlpenaHumphrey42.5%
 
Nixon50.8%
 
Wallace6.6%
 
Other0.1%


AntrimHumphrey33.3%
 
Nixon59.2%
 
Wallace7.4%
 
Other0.0%


ArenacHumphrey39.4%
 
Nixon52.4%
 
Wallace8.1%
 
Other0.1%


BaragaHumphrey50.6%
 
Nixon45.4%
 
Wallace3.5%
 
Other0.4%


BarryHumphrey33.8%
 
Nixon55.1%
 
Wallace10.9%
 
Other0.2%


BayHumphrey50.3%
 
Nixon44.1%
 
Wallace5.4%
 
Other0.2%


BenzieHumphrey32.7%
 
Nixon60.9%
 
Wallace6.2%
 
Other0.2%


BerrienHumphrey33.8%
 
Nixon51.1%
 
Wallace14.8%
 
Other0.3%


BranchHumphrey35.7%
 
Nixon55.9%
 
Wallace8.2%
 
Other0.2%


CalhounHumphrey41.2%
 
Nixon47.6%
 
Wallace10.8%
 
Other0.4%


CassHumphrey37.7%
 
Nixon46.9%
 
Wallace15.1%
 
Other0.2%


CharlevoixHumphrey36.5%
 
Nixon55.1%
 
Wallace8.3%
 
Other0.1%


CheboyganHumphrey41.2%
 
Nixon49.6%
 
Wallace9.2%
 
Other0.0%


ChippewaHumphrey40.1%
 
Nixon52.0%
 
Wallace7.7%
 
Other0.1%


ClareHumphrey32.7%
 
Nixon56.9%
 
Wallace10.3%
 
Other0.1%


ClintonHumphrey33.5%
 
Nixon56.8%
 
Wallace9.6%
 
Other0.2%


CrawfordHumphrey36.7%
 
Nixon55.0%
 
Wallace8.1%
 
Other0.1%


DeltaHumphrey54.4%
 
Nixon40.6%
 
Wallace4.9%
 
Other0.1%


DickinsonHumphrey51.2%
 
Nixon44.0%
 
Wallace4.8%
 
Other0.1%


EatonHumphrey33.6%
 
Nixon57.1%
 
Wallace9.1%
 
Other0.2%


EmmetHumphrey35.0%
 
Nixon58.8%
 
Wallace6.0%
 
Other0.2%


GeneseeHumphrey45.8%
 
Nixon39.0%
 
Wallace15.0%
 
Other0.2%


GladwinHumphrey33.2%
 
Nixon56.6%
 
Wallace10.2%
 
Other0.1%


GogebicHumphrey56.0%
 
Nixon39.7%
 
Wallace4.2%
 
Other0.1%


Grand TraverseHumphrey32.5%
 
Nixon61.5%
 
Wallace5.8%
 
Other0.2%


GratiotHumphrey30.1%
 
Nixon62.7%
 
Wallace7.1%
 
Other0.1%


HillsdaleHumphrey28.3%
 
Nixon63.3%
 
Wallace8.2%
 
Other0.2%


HoughtonHumphrey49.4%
 
Nixon46.9%
 
Wallace3.3%
 
Other0.3%


HuronHumphrey26.6%
 
Nixon64.5%
 
Wallace8.7%
 
Other0.2%


InghamHumphrey41.1%
 
Nixon51.5%
 
Wallace7.1%
 
Other0.4%


IoniaHumphrey37.9%
 
Nixon54.0%
 
Wallace7.9%
 
Other0.2%


IoscoHumphrey34.5%
 
Nixon55.4%
 
Wallace10.0%
 
Other0.0%


IronHumphrey53.1%
 
Nixon42.4%
 
Wallace4.4%
 
Other0.1%


IsabellaHumphrey35.9%
 
Nixon57.4%
 
Wallace6.5%
 
Other0.2%


JacksonHumphrey35.1%
 
Nixon53.7%
 
Wallace11.0%
 
Other0.3%


KalamazooHumphrey35.8%
 
Nixon53.9%
 
Wallace10.0%
 
Other0.3%


KalkaskaHumphrey33.7%
 
Nixon53.3%
 
Wallace12.9%
 
Other0.1%


KentHumphrey38.7%
 
Nixon53.7%
 
Wallace7.2%
 
Other0.4%


KeweenawHumphrey50.4%
 
Nixon44.0%
 
Wallace5.4%
 
Other0.2%


LakeHumphrey53.0%
 
Nixon39.1%
 
Wallace7.9%
 
Other0.1%


LapeerHumphrey32.2%
 
Nixon54.9%
 
Wallace12.9%
 
Other0.1%


LeelanauHumphrey33.5%
 
Nixon60.1%
 
Wallace6.3%
 
Other0.2%


LenaweeHumphrey36.2%
 
Nixon55.9%
 
Wallace7.5%
 
Other0.4%


LivingstonHumphrey35.9%
 
Nixon51.0%
 
Wallace12.9%
 
Other0.2%


LuceHumphrey36.9%
 
Nixon58.3%
 
Wallace4.7%
 
Other0.0%


MackinacHumphrey38.3%
 
Nixon54.8%
 
Wallace6.9%
 
Other0.0%


MacombHumphrey55.2%
 
Nixon30.4%
 
Wallace14.1%
 
Other0.3%


ManisteeHumphrey44.2%
 
Nixon48.2%
 
Wallace7.4%
 
Other0.2%


MarquetteHumphrey53.3%
 
Nixon42.7%
 
Wallace3.8%
 
Other0.2%


MasonHumphrey37.2%
 
Nixon54.0%
 
Wallace8.7%
 
Other0.1%


MecostaHumphrey32.5%
 
Nixon60.0%
 
Wallace7.4%
 
Other0.1%


MenomineeHumphrey48.2%
 
Nixon45.5%
 
Wallace6.1%
 
Other0.1%


MidlandHumphrey31.4%
 
Nixon60.6%
 
Wallace7.8%
 
Other0.2%


MissaukeeHumphrey23.1%
 
Nixon67.7%
 
Wallace9.2%
 
Other0.1%


MonroeHumphrey47.8%
 
Nixon39.6%
 
Wallace12.3%
 
Other0.2%


MontcalmHumphrey35.6%
 
Nixon55.9%
 
Wallace8.3%
 
Other0.2%


MontmorencyHumphrey34.5%
 
Nixon54.4%
 
Wallace11.1%
 
Other0.1%


MuskegonHumphrey41.7%
 
Nixon48.1%
 
Wallace9.9%
 
Other0.3%


NewaygoHumphrey30.5%
 
Nixon60.0%
 
Wallace9.4%
 
Other0.1%


OaklandHumphrey44.8%
 
Nixon45.3%
 
Wallace9.6%
 
Other0.4%


OceanaHumphrey30.9%
 
Nixon56.2%
 
Wallace12.6%
 
Other0.3%


OgemawHumphrey35.6%
 
Nixon54.6%
 
Wallace9.8%
 
Other0.1%


OntonagonHumphrey49.2%
 
Nixon45.7%
 
Wallace5.0%
 
Other0.1%


OsceolaHumphrey26.0%
 
Nixon63.8%
 
Wallace10.0%
 
Other0.2%


OscodaHumphrey30.5%
 
Nixon61.0%
 
Wallace8.5%


OtsegoHumphrey43.8%
 
Nixon49.3%
 
Wallace6.8%
 
Other0.1%


OttawaHumphrey25.2%
 
Nixon67.6%
 
Wallace7.0%
 
Other0.2%


Presque IsleHumphrey43.8%
 
Nixon48.8%
 
Wallace7.3%
 
Other0.0%


RoscommonHumphrey34.8%
 
Nixon55.9%
 
Wallace9.1%
 
Other0.2%


SaginawHumphrey41.7%
 
Nixon49.2%
 
Wallace8.9%
 
Other0.2%


St. ClairHumphrey38.1%
 
Nixon49.4%
 
Wallace12.3%
 
Other0.2%


St. JosephHumphrey30.7%
 
Nixon59.2%
 
Wallace10.0%
 
Other0.2%


SanilacHumphrey22.5%
 
Nixon65.5%
 
Wallace11.9%
 
Other0.1%


SchoolcraftHumphrey48.6%
 
Nixon45.4%
 
Wallace5.9%
 
Other0.1%


ShiawasseeHumphrey38.3%
 
Nixon50.9%
 
Wallace10.5%
 
Other0.3%


TuscolaHumphrey28.3%
 
Nixon61.4%
 
Wallace10.1%
 
Other0.2%


Van BurenHumphrey35.4%
 
Nixon51.8%
 
Wallace12.4%
 
Other0.3%


WashtenawHumphrey42.5%
 
Nixon46.8%
 
Wallace9.6%
 
Other1.1%


WayneHumphrey63.2%
 
Nixon26.2%
 
Wallace10.2%
 
Other0.4%


WexfordHumphrey36.6%
 
Nixon56.4%
 
Wallace6.9%
 
Other0.1%


National DataGraph for 1968 - Michigan Results for 1968

Login

Terms of Use - DCMA Policy - Privacy Policy and Cookies


© Dave Leip's Atlas of U.S. Elections, LLC 2019 All Rights Reserved