1970 Lt. Gubernatorial General Election Data Graphs - Kansas
Note: The Google advertisement links below may advocate political positions that this site does not endorse.
Data for this Contest was Contributed by on 2017-03-04
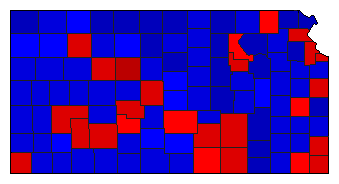
Map

AllenRome45.4%
 
Shultz50.5%
 
Other4.1%


AndersonRome49.7%
 
Shultz48.5%
 
Other1.7%


AtchisonRome52.0%
 
Shultz46.4%
 
Other1.6%


BarberRome45.2%
 
Shultz52.1%
 
Other2.6%


BartonRome54.5%
 
Shultz42.5%
 
Other3.0%


BourbonRome46.4%
 
Shultz50.1%
 
Other3.4%


BrownRome31.9%
 
Shultz65.9%
 
Other2.2%


ButlerRome53.0%
 
Shultz43.8%
 
Other3.2%


ChaseRome41.1%
 
Shultz56.4%
 
Other2.5%


ChautauquaRome33.7%
 
Shultz63.6%
 
Other2.7%


CherokeeRome54.7%
 
Shultz42.7%
 
Other2.7%


CheyenneRome36.0%
 
Shultz60.8%
 
Other3.3%


ClarkRome43.8%
 
Shultz52.1%
 
Other4.2%


ClayRome35.7%
 
Shultz60.2%
 
Other4.1%


CloudRome46.3%
 
Shultz50.8%
 
Other3.0%


CoffeyRome38.7%
 
Shultz59.3%
 
Other2.0%


ComancheRome40.3%
 
Shultz56.7%
 
Other3.0%


CowleyRome50.2%
 
Shultz46.5%
 
Other3.3%


CrawfordRome53.2%
 
Shultz44.3%
 
Other2.5%


DecaturRome47.9%
 
Shultz49.9%
 
Other2.2%


DickinsonRome37.7%
 
Shultz60.2%
 
Other2.1%


DoniphanRome37.5%
 
Shultz60.6%
 
Other1.9%


DouglasRome42.7%
 
Shultz55.6%
 
Other1.7%


EdwardsRome49.6%
 
Shultz48.1%
 
Other2.3%


ElkRome36.3%
 
Shultz60.8%
 
Other2.9%


EllisRome67.5%
 
Shultz31.0%
 
Other1.4%


EllsworthRome48.2%
 
Shultz49.5%
 
Other2.3%


FinneyRome51.3%
 
Shultz46.4%
 
Other2.3%


FordRome51.5%
 
Shultz46.5%
 
Other1.9%


FranklinRome43.8%
 
Shultz53.9%
 
Other2.3%


GearyRome53.8%
 
Shultz43.0%
 
Other3.2%


GoveRome46.3%
 
Shultz51.3%
 
Other2.5%


GrahamRome40.9%
 
Shultz57.1%
 
Other2.0%


GrantRome45.1%
 
Shultz53.0%
 
Other1.9%


GrayRome50.4%
 
Shultz48.2%
 
Other1.4%


GreeleyRome43.3%
 
Shultz54.7%
 
Other1.9%


GreenwoodRome37.9%
 
Shultz60.4%
 
Other1.7%


HamiltonRome47.6%
 
Shultz50.9%
 
Other1.5%


HarperRome40.3%
 
Shultz58.0%
 
Other1.7%


HarveyRome45.9%
 
Shultz52.5%
 
Other1.5%


HaskellRome48.2%
 
Shultz49.6%
 
Other2.1%


HodgemanRome48.0%
 
Shultz50.7%
 
Other1.3%


JacksonRome39.4%
 
Shultz59.1%
 
Other1.5%


JeffersonRome32.6%
 
Shultz66.1%
 
Other1.3%


JewellRome35.4%
 
Shultz61.7%
 
Other2.9%


JohnsonRome42.9%
 
Shultz55.0%
 
Other2.1%


KearnyRome45.3%
 
Shultz53.5%
 
Other1.2%


KingmanRome48.3%
 
Shultz49.7%
 
Other2.0%


KiowaRome37.7%
 
Shultz58.9%
 
Other3.4%


LabetteRome49.0%
 
Shultz48.6%
 
Other2.4%


LaneRome44.3%
 
Shultz54.5%
 
Other1.2%


LeavenworthRome53.1%
 
Shultz45.8%
 
Other1.2%


LincolnRome35.8%
 
Shultz62.7%
 
Other1.5%


LinnRome38.5%
 
Shultz60.4%
 
Other1.1%


LoganRome44.0%
 
Shultz54.3%
 
Other1.8%


LyonRome49.0%
 
Shultz49.5%
 
Other1.5%


McPhersonRome44.5%
 
Shultz53.4%
 
Other2.1%


MarionRome37.6%
 
Shultz60.6%
 
Other1.8%


MarshallRome43.3%
 
Shultz55.4%
 
Other1.2%


MeadeRome42.0%
 
Shultz54.9%
 
Other3.0%


MiamiRome52.6%
 
Shultz45.8%
 
Other1.7%


MitchellRome44.5%
 
Shultz53.7%
 
Other1.8%


MontgomeryRome44.1%
 
Shultz53.9%
 
Other2.0%


MorrisRome41.3%
 
Shultz56.9%
 
Other1.8%


MortonRome50.4%
 
Shultz47.8%
 
Other1.8%


NemahaRome49.5%
 
Shultz48.4%
 
Other2.0%


NeoshoRome46.5%
 
Shultz50.6%
 
Other2.9%


NessRome45.5%
 
Shultz52.7%
 
Other1.8%


NortonRome37.3%
 
Shultz60.2%
 
Other2.5%


OsageRome44.9%
 
Shultz53.7%
 
Other1.4%


OsborneRome34.2%
 
Shultz62.5%
 
Other3.3%


OttawaRome40.5%
 
Shultz56.7%
 
Other2.8%


PawneeRome56.0%
 
Shultz42.6%
 
Other1.4%


PhillipsRome33.9%
 
Shultz62.7%
 
Other3.4%


PottawatomieRome38.3%
 
Shultz60.1%
 
Other1.6%


PrattRome48.7%
 
Shultz48.8%
 
Other2.5%


RawlinsRome42.2%
 
Shultz55.5%
 
Other2.3%


RenoRome49.0%
 
Shultz48.2%
 
Other2.8%


RepublicRome38.8%
 
Shultz59.1%
 
Other2.2%


RiceRome48.1%
 
Shultz49.8%
 
Other2.0%


RileyRome50.0%
 
Shultz47.7%
 
Other2.3%


RooksRome46.9%
 
Shultz49.9%
 
Other3.2%


RushRome46.9%
 
Shultz51.1%
 
Other2.0%


RussellRome40.0%
 
Shultz58.2%
 
Other1.8%


SalineRome47.1%
 
Shultz51.0%
 
Other1.8%


ScottRome40.9%
 
Shultz56.2%
 
Other2.9%


SedgwickRome52.9%
 
Shultz39.6%
 
Other7.6%


SewardRome47.1%
 
Shultz50.2%
 
Other2.7%


ShawneeRome47.9%
 
Shultz50.3%
 
Other1.8%


SheridanRome50.3%
 
Shultz48.3%
 
Other1.4%


ShermanRome48.3%
 
Shultz49.0%
 
Other2.7%


SmithRome35.0%
 
Shultz62.3%
 
Other2.6%


StaffordRome47.2%
 
Shultz50.8%
 
Other2.0%


StantonRome45.7%
 
Shultz51.4%
 
Other2.9%


StevensRome46.7%
 
Shultz50.6%
 
Other2.8%


SumnerRome49.7%
 
Shultz47.4%
 
Other2.9%


ThomasRome48.9%
 
Shultz49.2%
 
Other1.8%


TregoRome51.9%
 
Shultz46.8%
 
Other1.3%


WabaunseeRome35.9%
 
Shultz61.9%
 
Other2.2%


WallaceRome35.7%
 
Shultz59.7%
 
Other4.7%


WashingtonRome34.1%
 
Shultz63.6%
 
Other2.3%


WichitaRome44.7%
 
Shultz53.9%
 
Other1.5%


WilsonRome38.5%
 
Shultz59.2%
 
Other2.3%


WoodsonRome39.9%
 
Shultz58.3%
 
Other1.8%


WyandotteRome59.8%
 
Shultz33.2%
 
Other7.0%


National DataGraph for 1970 - Kansas Results for 1970

Login

Terms of Use - DCMA Policy - Privacy Policy and Cookies


© Dave Leip's Atlas of U.S. Elections, LLC 2019 All Rights Reserved