1970 Senatorial General Election Data Graphs - New York
Note: The Google advertisement links below may advocate political positions that this site does not endorse.
Data for this Contest was Contributed by on 2014-11-14
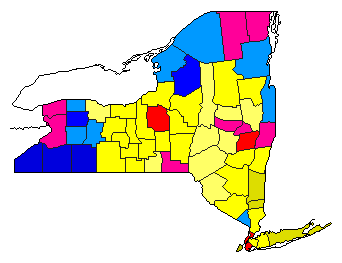
Map

AlbanyOttering44.9%
 
Goodell29.3%
 
Other25.8%


AlleganyOttering19.2%
 
Goodell50.7%
 
Other30.1%


BronxOttering46.2%
 
Goodell18.2%
 
Other35.6%


BroomeOttering34.0%
 
Goodell33.6%
 
Other32.4%


CattaraugusOttering24.8%
 
Goodell50.9%
 
Other24.3%


CayugaOttering31.3%
 
Goodell21.9%
 
Other46.8%


ChautauquaOttering23.6%
 
Goodell53.6%
 
Other22.7%


ChemungOttering31.0%
 
Goodell26.1%
 
Other42.9%


ChenangoOttering27.4%
 
Goodell31.7%
 
Other40.9%


ClintonOttering39.1%
 
Goodell35.6%
 
Other25.4%


ColumbiaOttering25.9%
 
Goodell31.6%
 
Other42.5%


CortlandOttering25.9%
 
Goodell29.4%
 
Other44.7%


DelawareOttering26.1%
 
Goodell36.7%
 
Other37.2%


DutchessOttering25.8%
 
Goodell22.6%
 
Other51.6%


ErieOttering38.9%
 
Goodell33.8%
 
Other27.3%


EssexOttering27.4%
 
Goodell39.0%
 
Other33.6%


FranklinOttering38.9%
 
Goodell34.9%
 
Other26.2%


FultonOttering34.0%
 
Goodell31.0%
 
Other35.0%


GeneseeOttering29.9%
 
Goodell40.4%
 
Other29.8%


GreeneOttering27.4%
 
Goodell30.2%
 
Other42.3%


HamiltonOttering23.4%
 
Goodell31.8%
 
Other44.8%


HerkimerOttering30.6%
 
Goodell29.7%
 
Other39.7%


JeffersonOttering30.6%
 
Goodell38.3%
 
Other31.1%


KingsOttering47.6%
 
Goodell19.2%
 
Other33.2%


LewisOttering29.9%
 
Goodell40.8%
 
Other29.3%


LivingstonOttering27.0%
 
Goodell37.3%
 
Other35.7%


MadisonOttering25.1%
 
Goodell28.0%
 
Other46.9%


MonroeOttering32.1%
 
Goodell28.4%
 
Other39.6%


MontgomeryOttering39.1%
 
Goodell27.2%
 
Other33.7%


NassauOttering32.8%
 
Goodell21.7%
 
Other45.5%


New YorkOttering48.7%
 
Goodell27.8%
 
Other23.5%


NiagaraOttering36.0%
 
Goodell31.4%
 
Other32.6%


OneidaOttering32.8%
 
Goodell26.2%
 
Other41.0%


OnondagaOttering41.5%
 
Goodell30.2%
 
Other28.3%


OntarioOttering28.1%
 
Goodell29.7%
 
Other42.1%


OrangeOttering26.3%
 
Goodell26.7%
 
Other47.0%


OrleansOttering28.6%
 
Goodell35.7%
 
Other35.7%


OswegoOttering28.5%
 
Goodell30.0%
 
Other41.4%


OtsegoOttering28.9%
 
Goodell33.2%
 
Other37.9%


PutnamOttering35.9%
 
Goodell12.7%
 
Other51.4%


QueensOttering38.4%
 
Goodell17.6%
 
Other44.0%


RensselaerOttering35.4%
 
Goodell33.6%
 
Other30.9%


RichmondOttering24.3%
 
Goodell13.8%
 
Other61.9%


RocklandOttering32.0%
 
Goodell37.6%
 
Other30.4%


St. LawrenceOttering31.9%
 
Goodell37.3%
 
Other30.8%


SaratogaOttering25.7%
 
Goodell36.8%
 
Other37.5%


SchenectadyOttering35.6%
 
Goodell30.9%
 
Other33.5%


SchoharieOttering33.0%
 
Goodell31.7%
 
Other35.3%


SchuylerOttering22.7%
 
Goodell31.6%
 
Other45.7%


SenecaOttering31.8%
 
Goodell28.2%
 
Other40.0%


SteubenOttering21.2%
 
Goodell36.5%
 
Other42.4%


SuffolkOttering27.3%
 
Goodell21.2%
 
Other51.5%


SullivanOttering33.9%
 
Goodell27.7%
 
Other38.3%


TiogaOttering30.4%
 
Goodell30.2%
 
Other39.4%


TompkinsOttering19.9%
 
Goodell32.2%
 
Other47.9%


UlsterOttering25.1%
 
Goodell25.4%
 
Other49.6%


WarrenOttering25.3%
 
Goodell33.9%
 
Other40.8%


WashingtonOttering27.0%
 
Goodell38.6%
 
Other34.4%


WayneOttering27.9%
 
Goodell31.1%
 
Other41.0%


WestchesterOttering36.8%
 
Goodell18.3%
 
Other44.9%


WyomingOttering27.0%
 
Goodell38.8%
 
Other34.2%


YatesOttering22.3%
 
Goodell33.8%
 
Other44.0%


National DataGraph for 1970 - New York Results for 1970

Login

Terms of Use - DCMA Policy - Privacy Policy and Cookies


© Dave Leip's Atlas of U.S. Elections, LLC 2019 All Rights Reserved