1976 State Auditor General Election Data Graphs - Pennsylvania
Note: The Google advertisement links below may advocate political positions that this site does not endorse.
Data for this Contest was Contributed by on 2016-06-08
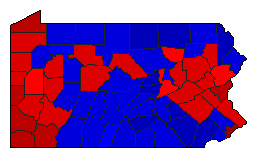
Map

AdamsBenedict45.0%
 
Gleason53.8%
 
Other1.2%


AlleghenyBenedict56.1%
 
Gleason42.2%
 
Other1.7%


ArmstrongBenedict52.8%
 
Gleason45.3%
 
Other1.9%


BeaverBenedict65.0%
 
Gleason32.7%
 
Other2.3%


BedfordBenedict39.3%
 
Gleason59.8%
 
Other0.9%


BerksBenedict57.6%
 
Gleason41.2%
 
Other1.2%


BlairBenedict39.2%
 
Gleason59.6%
 
Other1.2%


BradfordBenedict36.5%
 
Gleason62.1%
 
Other1.5%


BucksBenedict50.4%
 
Gleason48.1%
 
Other1.5%


ButlerBenedict49.9%
 
Gleason48.1%
 
Other2.1%


CambriaBenedict44.8%
 
Gleason54.1%
 
Other1.1%


CameronBenedict44.9%
 
Gleason53.9%
 
Other1.2%


CarbonBenedict57.3%
 
Gleason41.8%
 
Other0.9%


CentreBenedict45.6%
 
Gleason52.2%
 
Other2.3%


ChesterBenedict38.4%
 
Gleason60.4%
 
Other1.1%


ClarionBenedict53.3%
 
Gleason45.2%
 
Other1.4%


ClearfieldBenedict50.1%
 
Gleason48.8%
 
Other1.1%


ClintonBenedict53.3%
 
Gleason45.2%
 
Other1.5%


ColumbiaBenedict57.0%
 
Gleason41.5%
 
Other1.5%


CrawfordBenedict55.3%
 
Gleason43.3%
 
Other1.5%


CumberlandBenedict38.8%
 
Gleason60.2%
 
Other1.0%


DauphinBenedict43.0%
 
Gleason55.8%
 
Other1.2%


DelawareBenedict45.4%
 
Gleason53.8%
 
Other0.7%


ElkBenedict56.2%
 
Gleason42.8%
 
Other1.0%


ErieBenedict69.6%
 
Gleason29.4%
 
Other1.1%


FayetteBenedict64.3%
 
Gleason34.5%
 
Other1.2%


ForestBenedict48.9%
 
Gleason49.2%
 
Other1.9%


FranklinBenedict46.7%
 
Gleason50.9%
 
Other2.4%


FultonBenedict49.0%
 
Gleason49.1%
 
Other1.9%


GreeneBenedict69.9%
 
Gleason28.5%
 
Other1.6%


HuntingdonBenedict39.4%
 
Gleason58.7%
 
Other1.9%


IndianaBenedict46.5%
 
Gleason52.0%
 
Other1.5%


JeffersonBenedict45.3%
 
Gleason53.4%
 
Other1.3%


JuniataBenedict46.1%
 
Gleason52.5%
 
Other1.4%


LackawannaBenedict58.6%
 
Gleason40.6%
 
Other0.8%


LancasterBenedict34.9%
 
Gleason64.0%
 
Other1.1%


LawrenceBenedict59.5%
 
Gleason39.1%
 
Other1.4%


LebanonBenedict37.8%
 
Gleason61.0%
 
Other1.2%


LehighBenedict52.7%
 
Gleason46.3%
 
Other1.0%


LuzerneBenedict59.9%
 
Gleason39.5%
 
Other0.6%


LycomingBenedict45.8%
 
Gleason52.3%
 
Other1.8%


McKeanBenedict39.9%
 
Gleason59.3%
 
Other0.7%


MercerBenedict56.1%
 
Gleason43.0%
 
Other0.9%


MifflinBenedict45.8%
 
Gleason53.3%
 
Other0.9%


MonroeBenedict49.7%
 
Gleason49.2%
 
Other1.1%


MontgomeryBenedict42.2%
 
Gleason56.9%
 
Other0.9%


MontourBenedict48.5%
 
Gleason49.4%
 
Other2.1%


NorthamptonBenedict61.0%
 
Gleason37.7%
 
Other1.3%


NorthumberlandBenedict49.6%
 
Gleason48.7%
 
Other1.8%


PerryBenedict41.0%
 
Gleason57.6%
 
Other1.3%


PhiladelphiaBenedict70.2%
 
Gleason28.7%
 
Other1.0%


PikeBenedict39.0%
 
Gleason59.9%
 
Other1.1%


PotterBenedict45.0%
 
Gleason53.5%
 
Other1.5%


SchuylkillBenedict52.9%
 
Gleason44.6%
 
Other2.5%


SnyderBenedict32.4%
 
Gleason65.8%
 
Other1.8%


SomersetBenedict42.4%
 
Gleason56.4%
 
Other1.2%


SullivanBenedict49.7%
 
Gleason49.6%
 
Other0.7%


SusquehannaBenedict40.0%
 
Gleason58.5%
 
Other1.5%


TiogaBenedict36.4%
 
Gleason62.0%
 
Other1.6%


UnionBenedict36.4%
 
Gleason61.7%
 
Other1.9%


VenangoBenedict45.6%
 
Gleason52.9%
 
Other1.5%


WarrenBenedict48.4%
 
Gleason50.4%
 
Other1.2%


WashingtonBenedict64.8%
 
Gleason32.8%
 
Other2.4%


WayneBenedict35.9%
 
Gleason62.5%
 
Other1.6%


WestmorelandBenedict57.7%
 
Gleason41.0%
 
Other1.3%


WyomingBenedict38.9%
 
Gleason60.0%
 
Other1.1%


YorkBenedict41.9%
 
Gleason57.2%
 
Other0.8%


National DataGraph for 1976 - Pennsylvania Results for 1976

Login

Terms of Use - DCMA Policy - Privacy Policy and Cookies


© Dave Leip's Atlas of U.S. Elections, LLC 2019 All Rights Reserved