1976 Presidential General Election Data Graphs - California
Note: The Google advertisement links below may advocate political positions that this site does not endorse.
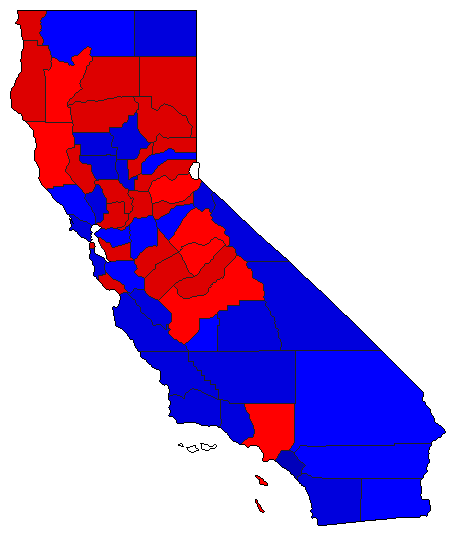
Map

AlamedaCarter57.9%
 
Ford38.1%
 
Other4.0%


AlpineCarter42.3%
 
Ford50.3%
 
Other7.4%


AmadorCarter50.3%
 
Ford46.1%
 
Other3.5%


ButteCarter44.1%
 
Ford51.8%
 
Other4.1%


CalaverasCarter47.9%
 
Ford49.1%
 
Other3.0%


ColusaCarter45.2%
 
Ford52.7%
 
Other2.1%


Contra CostaCarter48.2%
 
Ford49.3%
 
Other2.4%


Del NorteCarter50.9%
 
Ford45.3%
 
Other3.8%


El DoradoCarter48.8%
 
Ford47.7%
 
Other3.5%


FresnoCarter49.7%
 
Ford48.1%
 
Other2.2%


GlennCarter45.0%
 
Ford52.7%
 
Other2.3%


HumboldtCarter54.2%
 
Ford41.6%
 
Other4.2%


ImperialCarter48.2%
 
Ford49.9%
 
Other1.9%


InyoCarter39.3%
 
Ford58.2%
 
Other2.5%


KernCarter45.6%
 
Ford52.3%
 
Other2.1%


KingsCarter48.4%
 
Ford49.7%
 
Other1.9%


LakeCarter51.9%
 
Ford44.5%
 
Other3.7%


LassenCarter54.3%
 
Ford43.0%
 
Other2.7%


Los AngelesCarter49.7%
 
Ford47.8%
 
Other2.5%


MaderaCarter51.2%
 
Ford46.0%
 
Other2.8%


MarinCarter42.9%
 
Ford52.5%
 
Other4.6%


MariposaCarter48.5%
 
Ford46.6%
 
Other4.9%


MendocinoCarter49.5%
 
Ford45.5%
 
Other5.0%


MercedCarter51.7%
 
Ford46.1%
 
Other2.3%


ModocCarter46.3%
 
Ford51.2%
 
Other2.5%


MonoCarter37.7%
 
Ford58.8%
 
Other3.5%


MontereyCarter46.0%
 
Ford51.0%
 
Other3.0%


NapaCarter44.9%
 
Ford51.8%
 
Other3.3%


NevadaCarter47.0%
 
Ford48.4%
 
Other4.7%


OrangeCarter35.3%
 
Ford62.2%
 
Other2.5%


PlacerCarter52.2%
 
Ford45.0%
 
Other2.8%


PlumasCarter52.2%
 
Ford43.9%
 
Other3.8%


RiversideCarter48.5%
 
Ford49.2%
 
Other2.3%


SacramentoCarter52.3%
 
Ford44.6%
 
Other3.1%


San BenitoCarter46.7%
 
Ford50.9%
 
Other2.4%


San BernardinoCarter47.9%
 
Ford49.5%
 
Other2.6%


San DiegoCarter41.6%
 
Ford55.7%
 
Other2.7%


San FranciscoCarter52.1%
 
Ford40.3%
 
Other7.6%


San JoaquinCarter48.1%
 
Ford49.6%
 
Other2.3%


San Luis ObispoCarter45.9%
 
Ford51.2%
 
Other2.9%


San MateoCarter44.4%
 
Ford50.6%
 
Other5.0%


Santa BarbaraCarter45.9%
 
Ford50.8%
 
Other3.3%


Santa ClaraCarter46.9%
 
Ford49.5%
 
Other3.6%


Santa CruzCarter51.1%
 
Ford43.1%
 
Other5.8%


ShastaCarter50.7%
 
Ford45.6%
 
Other3.6%


SierraCarter53.4%
 
Ford43.1%
 
Other3.5%


SiskiyouCarter48.3%
 
Ford48.4%
 
Other3.3%


SolanoCarter54.6%
 
Ford42.4%
 
Other3.0%


SonomaCarter47.5%
 
Ford47.7%
 
Other4.8%


StanislausCarter52.3%
 
Ford44.8%
 
Other2.8%


SutterCarter43.2%
 
Ford54.2%
 
Other2.6%


TehamaCarter51.3%
 
Ford44.8%
 
Other3.9%


TrinityCarter49.9%
 
Ford45.7%
 
Other4.5%


TulareCarter43.7%
 
Ford54.5%
 
Other1.8%


TuolumneCarter49.9%
 
Ford46.9%
 
Other3.1%


VenturaCarter44.1%
 
Ford53.2%
 
Other2.7%


YoloCarter54.3%
 
Ford42.4%
 
Other3.3%


YubaCarter52.5%
 
Ford44.7%
 
Other2.8%


National DataGraph for 1976 - California Results for 1976

Login

Terms of Use - DCMA Policy - Privacy Policy and Cookies


© Dave Leip's Atlas of U.S. Elections, LLC 2019 All Rights Reserved