1980 Senatorial General Election Data Graphs - Alabama
Note: The Google advertisement links below may advocate political positions that this site does not endorse.
Data for this Contest was Contributed by on 2008-07-17
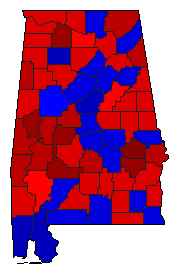
Map

AutaugaFolsom40.7%
 
Denton55.1%
 
Other4.2%


BaldwinFolsom27.7%
 
Denton68.9%
 
Other3.3%


BarbourFolsom51.9%
 
Denton43.6%
 
Other4.4%


BibbFolsom61.4%
 
Denton37.6%
 
Other0.9%


BlountFolsom43.3%
 
Denton55.6%
 
Other1.1%


BullockFolsom72.9%
 
Denton22.9%
 
Other4.2%


ButlerFolsom51.1%
 
Denton44.8%
 
Other4.1%


CalhounFolsom42.4%
 
Denton55.9%
 
Other1.7%


ChambersFolsom57.4%
 
Denton39.8%
 
Other2.8%


CherokeeFolsom62.8%
 
Denton34.9%
 
Other2.3%


ChiltonFolsom43.1%
 
Denton55.8%
 
Other1.1%


ChoctawFolsom61.3%
 
Denton38.0%
 
Other0.7%


ClarkeFolsom49.1%
 
Denton47.6%
 
Other3.3%


ClayFolsom52.2%
 
Denton44.2%
 
Other3.6%


CleburneFolsom52.0%
 
Denton46.3%
 
Other1.8%


CoffeeFolsom50.9%
 
Denton46.1%
 
Other3.0%


ColbertFolsom59.3%
 
Denton37.6%
 
Other3.1%


ConecuhFolsom54.0%
 
Denton43.8%
 
Other2.2%


CoosaFolsom59.7%
 
Denton36.6%
 
Other3.7%


CovingtonFolsom47.2%
 
Denton50.8%
 
Other2.0%


CrenshawFolsom57.5%
 
Denton41.8%
 
Other0.8%


CullmanFolsom55.6%
 
Denton43.4%
 
Other1.0%


DaleFolsom42.0%
 
Denton55.4%
 
Other2.5%


DallasFolsom56.7%
 
Denton39.8%
 
Other3.5%


DeKalbFolsom47.3%
 
Denton52.4%
 
Other0.3%


ElmoreFolsom41.7%
 
Denton55.5%
 
Other2.8%


EscambiaFolsom40.5%
 
Denton56.5%
 
Other3.0%


EtowahFolsom52.8%
 
Denton45.8%
 
Other1.5%


FayetteFolsom57.4%
 
Denton42.3%
 
Other0.3%


FranklinFolsom56.5%
 
Denton42.0%
 
Other1.5%


GenevaFolsom56.6%
 
Denton41.7%
 
Other1.7%


GreeneFolsom76.1%
 
Denton22.8%
 
Other1.1%


HaleFolsom66.1%
 
Denton30.9%
 
Other3.0%


HenryFolsom54.4%
 
Denton43.4%
 
Other2.1%


HoustonFolsom38.6%
 
Denton59.5%
 
Other1.8%


JacksonFolsom65.3%
 
Denton32.0%
 
Other2.7%


JeffersonFolsom42.0%
 
Denton54.0%
 
Other4.0%


LamarFolsom60.6%
 
Denton39.0%
 
Other0.4%


LauderdaleFolsom53.9%
 
Denton42.9%
 
Other3.2%


LawrenceFolsom71.3%
 
Denton27.5%
 
Other1.2%


LeeFolsom41.9%
 
Denton54.0%
 
Other4.1%


LimestoneFolsom57.0%
 
Denton39.1%
 
Other3.9%


LowndesFolsom69.1%
 
Denton26.4%
 
Other4.5%


MaconFolsom80.5%
 
Denton14.4%
 
Other5.1%


MadisonFolsom44.6%
 
Denton52.6%
 
Other2.8%


MarengoFolsom60.1%
 
Denton36.0%
 
Other3.9%


MarionFolsom50.0%
 
Denton47.5%
 
Other2.5%


MarshallFolsom51.5%
 
Denton45.0%
 
Other3.5%


MobileFolsom34.9%
 
Denton63.1%
 
Other2.0%


MonroeFolsom47.2%
 
Denton50.9%
 
Other1.9%


MontgomeryFolsom43.5%
 
Denton53.7%
 
Other2.9%


MorganFolsom49.0%
 
Denton48.1%
 
Other2.9%


PerryFolsom70.1%
 
Denton29.5%
 
Other0.4%


PickensFolsom58.9%
 
Denton40.4%
 
Other0.7%


PikeFolsom51.5%
 
Denton45.9%
 
Other2.6%


RandolphFolsom56.0%
 
Denton38.4%
 
Other5.6%


RussellFolsom66.3%
 
Denton27.2%
 
Other6.6%


St. ClairFolsom37.2%
 
Denton58.4%
 
Other4.3%


ShelbyFolsom31.4%
 
Denton66.2%
 
Other2.5%


SumterFolsom63.6%
 
Denton35.0%
 
Other1.3%


TalladegaFolsom49.5%
 
Denton48.6%
 
Other1.9%


TallapoosaFolsom53.3%
 
Denton43.8%
 
Other2.9%


TuscaloosaFolsom47.3%
 
Denton49.7%
 
Other3.0%


WalkerFolsom58.9%
 
Denton39.6%
 
Other1.4%


WashingtonFolsom55.8%
 
Denton43.3%
 
Other0.8%


WilcoxFolsom71.4%
 
Denton28.4%
 
Other0.2%


WinstonFolsom38.7%
 
Denton60.9%
 
Other0.4%


National DataGraph for 1980 - Alabama Results for 1980

Login

Terms of Use - DCMA Policy - Privacy Policy and Cookies


© Dave Leip's Atlas of U.S. Elections, LLC 2019 All Rights Reserved