1980 Senatorial General Election Data Graphs - North Dakota
Note: The Google advertisement links below may advocate political positions that this site does not endorse.
Data for this Contest was Contributed by on 2016-05-15
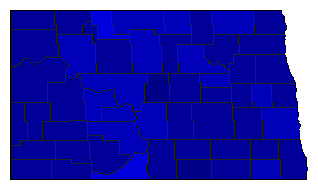
Map

AdamsJohanneson29.5%
 
Andrews70.4%
 
Other0.1%


BarnesJohanneson28.6%
 
Andrews70.6%
 
Other0.9%


BensonJohanneson32.7%
 
Andrews67.1%
 
Other0.1%


BillingsJohanneson29.3%
 
Andrews70.2%
 
Other0.4%


BottineauJohanneson30.2%
 
Andrews69.6%
 
Other0.2%


BowmanJohanneson25.4%
 
Andrews74.4%
 
Other0.2%


BurkeJohanneson25.8%
 
Andrews74.1%
 
Other0.1%


BurleighJohanneson29.4%
 
Andrews69.4%
 
Other1.2%


CassJohanneson30.3%
 
Andrews68.9%
 
Other0.8%


CavalierJohanneson32.0%
 
Andrews68.0%
 
Other0.1%


DickeyJohanneson26.8%
 
Andrews73.0%
 
Other0.2%


DivideJohanneson28.9%
 
Andrews70.8%
 
Other0.3%


DunnJohanneson28.0%
 
Andrews71.9%
 
Other0.1%


EddyJohanneson35.0%
 
Andrews64.8%
 
Other0.2%


EmmonsJohanneson27.1%
 
Andrews72.4%
 
Other0.5%


FosterJohanneson25.5%
 
Andrews74.3%
 
Other0.3%


Golden ValleyJohanneson27.6%
 
Andrews72.1%
 
Other0.4%


Grand ForksJohanneson27.4%
 
Andrews70.5%
 
Other2.1%


GrantJohanneson25.3%
 
Andrews74.2%
 
Other0.5%


GriggsJohanneson29.5%
 
Andrews70.4%
 
Other0.1%


HettingerJohanneson27.2%
 
Andrews72.6%
 
Other0.2%


KidderJohanneson27.2%
 
Andrews72.5%
 
Other0.3%


LaMoureJohanneson27.1%
 
Andrews72.3%
 
Other0.6%


LoganJohanneson23.2%
 
Andrews76.7%
 
Other0.2%


McHenryJohanneson30.1%
 
Andrews69.7%
 
Other0.2%


McIntoshJohanneson15.9%
 
Andrews83.9%
 
Other0.2%


McKenzieJohanneson28.9%
 
Andrews70.9%
 
Other0.2%


McLeanJohanneson31.7%
 
Andrews68.0%
 
Other0.3%


MercerJohanneson32.3%
 
Andrews67.4%
 
Other0.3%


MortonJohanneson34.5%
 
Andrews64.3%
 
Other1.2%


MountrailJohanneson35.4%
 
Andrews64.2%
 
Other0.3%


NelsonJohanneson27.7%
 
Andrews71.9%
 
Other0.4%


OliverJohanneson31.2%
 
Andrews68.6%
 
Other0.2%


PembinaJohanneson25.1%
 
Andrews74.2%
 
Other0.7%


PierceJohanneson24.5%
 
Andrews75.1%
 
Other0.4%


RamseyJohanneson27.4%
 
Andrews72.0%
 
Other0.6%


RansomJohanneson27.5%
 
Andrews72.1%
 
Other0.4%


RenvilleJohanneson47.2%
 
Andrews52.7%
 
Other0.1%


RichlandJohanneson26.5%
 
Andrews72.8%
 
Other0.7%


RoletteJohanneson36.6%
 
Andrews62.4%
 
Other1.0%


SargentJohanneson32.1%
 
Andrews67.6%
 
Other0.3%


SheridanJohanneson16.6%
 
Andrews83.2%
 
Other0.2%


SiouxJohanneson42.0%
 
Andrews57.3%
 
Other0.6%


SlopeJohanneson29.0%
 
Andrews70.8%
 
Other0.2%


StarkJohanneson26.9%
 
Andrews72.4%
 
Other0.6%


SteeleJohanneson30.9%
 
Andrews68.9%
 
Other0.2%


StutsmanJohanneson27.9%
 
Andrews70.7%
 
Other1.3%


TownerJohanneson26.0%
 
Andrews73.9%
 
Other0.1%


TraillJohanneson24.8%
 
Andrews74.5%
 
Other0.6%


WalshJohanneson25.5%
 
Andrews74.1%
 
Other0.3%


WardJohanneson28.9%
 
Andrews70.3%
 
Other0.8%


WellsJohanneson26.1%
 
Andrews73.7%
 
Other0.2%


WilliamsJohanneson29.4%
 
Andrews70.1%
 
Other0.6%


National DataGraph for 1980 - North Dakota Results for 1980

Login

Terms of Use - DCMA Policy - Privacy Policy and Cookies


© Dave Leip's Atlas of U.S. Elections, LLC 2019 All Rights Reserved