1987 Gubernatorial Open Runoff Election Data Graphs - Louisiana
Note: The Google advertisement links below may advocate political positions that this site does not endorse.
Data for this Contest was Contributed by on 2007-01-21
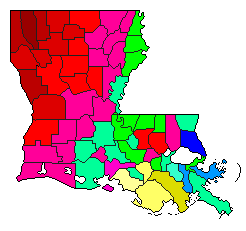
Map

AcadiaRoemer28.8%
 
Livingston12.1%
 
Edwards32.7%
 
Other26.4%


AllenRoemer34.5%
 
Livingston13.6%
 
Edwards30.5%
 
Other21.3%


AscensionRoemer34.7%
 
Livingston12.8%
 
Edwards28.2%
 
Other24.2%


AssumptionRoemer18.7%
 
Livingston7.5%
 
Edwards31.3%
 
Other42.5%


AvoyellesRoemer33.7%
 
Livingston11.4%
 
Edwards30.5%
 
Other24.4%


BeauregardRoemer47.5%
 
Livingston18.2%
 
Edwards15.7%
 
Other18.6%


BienvilleRoemer50.0%
 
Livingston5.5%
 
Edwards35.1%
 
Other9.4%


BossierRoemer76.6%
 
Livingston5.3%
 
Edwards14.2%
 
Other3.9%


CaddoRoemer66.3%
 
Livingston5.7%
 
Edwards23.4%
 
Other4.6%


CalcasieuRoemer39.8%
 
Livingston16.2%
 
Edwards22.9%
 
Other21.1%


CaldwellRoemer36.1%
 
Livingston19.4%
 
Edwards18.3%
 
Other26.2%


CameronRoemer35.0%
 
Livingston9.5%
 
Edwards29.6%
 
Other25.9%


CatahoulaRoemer34.1%
 
Livingston12.0%
 
Edwards24.4%
 
Other29.5%


ClaiborneRoemer52.5%
 
Livingston4.9%
 
Edwards34.3%
 
Other8.3%


ConcordiaRoemer27.2%
 
Livingston13.9%
 
Edwards30.1%
 
Other28.8%


De SotoRoemer55.0%
 
Livingston3.2%
 
Edwards34.8%
 
Other7.0%


East Baton RougeRoemer40.7%
 
Livingston20.4%
 
Edwards23.6%
 
Other15.3%


East CarrollRoemer20.5%
 
Livingston13.7%
 
Edwards47.0%
 
Other18.9%


East FelicianaRoemer25.0%
 
Livingston15.8%
 
Edwards44.5%
 
Other14.8%


EvangelineRoemer32.7%
 
Livingston10.3%
 
Edwards29.1%
 
Other27.9%


FranklinRoemer36.2%
 
Livingston14.3%
 
Edwards25.2%
 
Other24.2%


GrantRoemer42.7%
 
Livingston17.6%
 
Edwards20.6%
 
Other19.1%


IberiaRoemer28.1%
 
Livingston16.8%
 
Edwards21.5%
 
Other33.6%


IbervilleRoemer25.5%
 
Livingston8.6%
 
Edwards41.7%
 
Other24.2%


JacksonRoemer42.8%
 
Livingston15.0%
 
Edwards28.0%
 
Other14.2%


JeffersonRoemer21.3%
 
Livingston34.9%
 
Edwards23.8%
 
Other20.0%


Jefferson DavisRoemer31.6%
 
Livingston14.8%
 
Edwards26.3%
 
Other27.4%


LafayetteRoemer32.3%
 
Livingston18.8%
 
Edwards23.2%
 
Other25.8%


LafourcheRoemer13.2%
 
Livingston12.6%
 
Edwards18.3%
 
Other55.9%


La SalleRoemer46.7%
 
Livingston14.9%
 
Edwards13.7%
 
Other24.7%


LincolnRoemer50.7%
 
Livingston13.7%
 
Edwards26.1%
 
Other9.5%


LivingstonRoemer43.1%
 
Livingston19.3%
 
Edwards18.1%
 
Other19.6%


MadisonRoemer23.8%
 
Livingston13.3%
 
Edwards40.3%
 
Other22.5%


MorehouseRoemer32.3%
 
Livingston21.7%
 
Edwards24.0%
 
Other22.0%


NatchitochesRoemer47.8%
 
Livingston9.6%
 
Edwards31.0%
 
Other11.7%


OrleansRoemer14.8%
 
Livingston22.8%
 
Edwards45.0%
 
Other17.4%


OuachitaRoemer37.2%
 
Livingston25.2%
 
Edwards21.7%
 
Other15.9%


PlaqueminesRoemer17.5%
 
Livingston23.0%
 
Edwards35.3%
 
Other24.2%


Pointe CoupeeRoemer28.6%
 
Livingston10.5%
 
Edwards41.4%
 
Other19.4%


RapidesRoemer37.5%
 
Livingston21.6%
 
Edwards23.4%
 
Other17.5%


Red RiverRoemer57.9%
 
Livingston3.7%
 
Edwards30.6%
 
Other7.7%


RichlandRoemer34.0%
 
Livingston18.9%
 
Edwards27.1%
 
Other19.9%


SabineRoemer67.5%
 
Livingston6.5%
 
Edwards19.4%
 
Other6.7%


St. BernardRoemer16.5%
 
Livingston33.1%
 
Edwards30.6%
 
Other19.8%


St. CharlesRoemer20.0%
 
Livingston19.4%
 
Edwards28.1%
 
Other32.4%


St. HelenaRoemer26.8%
 
Livingston10.4%
 
Edwards46.2%
 
Other16.6%


St. JamesRoemer17.7%
 
Livingston7.6%
 
Edwards40.7%
 
Other34.0%


St. John the BaptistRoemer21.2%
 
Livingston15.7%
 
Edwards37.5%
 
Other25.6%


St. LandryRoemer29.6%
 
Livingston11.8%
 
Edwards37.5%
 
Other21.0%


St. MartinRoemer19.8%
 
Livingston12.7%
 
Edwards35.6%
 
Other31.9%


St. MaryRoemer26.6%
 
Livingston12.7%
 
Edwards23.4%
 
Other37.2%


St. TammanyRoemer25.7%
 
Livingston40.9%
 
Edwards19.8%
 
Other13.6%


TangipahoaRoemer33.7%
 
Livingston17.5%
 
Edwards31.8%
 
Other16.9%


TensasRoemer21.4%
 
Livingston17.1%
 
Edwards42.3%
 
Other19.2%


TerrebonneRoemer19.5%
 
Livingston17.6%
 
Edwards21.3%
 
Other41.6%


UnionRoemer41.6%
 
Livingston16.8%
 
Edwards24.1%
 
Other17.5%


VermilionRoemer24.0%
 
Livingston12.0%
 
Edwards30.2%
 
Other33.7%


VernonRoemer54.5%
 
Livingston12.0%
 
Edwards19.6%
 
Other13.9%


WashingtonRoemer30.8%
 
Livingston16.5%
 
Edwards31.5%
 
Other21.2%


WebsterRoemer64.9%
 
Livingston5.1%
 
Edwards23.6%
 
Other6.3%


West Baton RougeRoemer30.8%
 
Livingston11.1%
 
Edwards38.3%
 
Other19.7%


West CarrollRoemer32.4%
 
Livingston18.8%
 
Edwards26.1%
 
Other22.7%


West FelicianaRoemer22.8%
 
Livingston14.4%
 
Edwards43.7%
 
Other19.1%


WinnRoemer44.5%
 
Livingston12.9%
 
Edwards28.2%
 
Other14.4%


National DataGraph for 1987 - Louisiana Results for 1987

Login

Terms of Use - DCMA Policy - Privacy Policy and Cookies


© Dave Leip's Atlas of U.S. Elections, LLC 2019 All Rights Reserved