1992 Presidential General Election Data Graphs - Alabama
Note: The Google advertisement links below may advocate political positions that this site does not endorse.
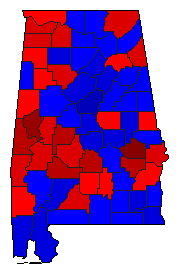
Map

AutaugaClinton30.9%
 
Bush55.9%
 
Perot12.3%
 
Other0.9%


BaldwinClinton26.2%
 
Bush56.5%
 
Perot16.5%
 
Other0.8%


BarbourClinton46.4%
 
Bush42.9%
 
Perot9.8%
 
Other1.0%


BibbClinton43.2%
 
Bush46.5%
 
Perot10.2%
 
Other0.1%


BlountClinton32.9%
 
Bush53.8%
 
Perot11.8%
 
Other1.5%


BullockClinton67.7%
 
Bush26.0%
 
Perot5.5%
 
Other0.8%


ButlerClinton47.4%
 
Bush41.2%
 
Perot10.2%
 
Other1.1%


CalhounClinton38.4%
 
Bush48.2%
 
Perot11.0%
 
Other2.4%


ChambersClinton45.4%
 
Bush43.4%
 
Perot10.9%
 
Other0.3%


CherokeeClinton53.6%
 
Bush34.9%
 
Perot10.7%
 
Other0.8%


ChiltonClinton34.2%
 
Bush56.2%
 
Perot9.4%
 
Other0.2%


ChoctawClinton52.1%
 
Bush40.6%
 
Perot6.5%
 
Other0.8%


ClarkeClinton42.9%
 
Bush46.9%
 
Perot7.4%
 
Other2.8%


ClayClinton36.0%
 
Bush49.7%
 
Perot11.3%
 
Other3.0%


CleburneClinton40.9%
 
Bush46.3%
 
Perot12.0%
 
Other0.7%


CoffeeClinton37.2%
 
Bush48.9%
 
Perot13.0%
 
Other0.9%


ColbertClinton54.4%
 
Bush36.0%
 
Perot9.3%
 
Other0.3%


ConecuhClinton50.0%
 
Bush39.1%
 
Perot8.8%
 
Other2.2%


CoosaClinton48.6%
 
Bush41.1%
 
Perot9.9%
 
Other0.4%


CovingtonClinton35.8%
 
Bush49.0%
 
Perot13.5%
 
Other1.7%


CrenshawClinton45.4%
 
Bush44.2%
 
Perot9.2%
 
Other1.2%


CullmanClinton36.0%
 
Bush49.6%
 
Perot14.2%
 
Other0.2%


DaleClinton32.3%
 
Bush51.5%
 
Perot15.3%
 
Other0.9%


DallasClinton56.4%
 
Bush37.7%
 
Perot5.7%
 
Other0.2%


DeKalbClinton38.2%
 
Bush48.7%
 
Perot12.7%
 
Other0.4%


ElmoreClinton30.5%
 
Bush55.7%
 
Perot13.6%
 
Other0.2%


EscambiaClinton37.5%
 
Bush46.4%
 
Perot12.6%
 
Other3.5%


EtowahClinton48.4%
 
Bush41.1%
 
Perot10.1%
 
Other0.4%


FayetteClinton45.2%
 
Bush42.6%
 
Perot11.9%
 
Other0.3%


FranklinClinton50.2%
 
Bush40.4%
 
Perot9.1%
 
Other0.3%


GenevaClinton36.7%
 
Bush49.1%
 
Perot13.4%
 
Other0.8%


GreeneClinton79.2%
 
Bush16.5%
 
Perot4.0%
 
Other0.3%


HaleClinton57.8%
 
Bush33.2%
 
Perot8.1%
 
Other0.9%


HenryClinton43.1%
 
Bush45.7%
 
Perot10.3%
 
Other0.9%


HoustonClinton29.8%
 
Bush58.3%
 
Perot11.7%
 
Other0.2%


JacksonClinton56.2%
 
Bush30.2%
 
Perot13.0%
 
Other0.6%


JeffersonClinton42.1%
 
Bush50.1%
 
Perot7.4%
 
Other0.3%


LamarClinton41.3%
 
Bush47.3%
 
Perot11.1%
 
Other0.3%


LauderdaleClinton47.2%
 
Bush40.7%
 
Perot11.9%
 
Other0.2%


LawrenceClinton54.9%
 
Bush30.9%
 
Perot14.0%
 
Other0.2%


LeeClinton38.8%
 
Bush47.6%
 
Perot12.9%
 
Other0.7%


LimestoneClinton37.4%
 
Bush45.7%
 
Perot16.6%
 
Other0.3%


LowndesClinton68.0%
 
Bush25.8%
 
Perot5.5%
 
Other0.7%


MaconClinton82.8%
 
Bush12.9%
 
Perot3.2%
 
Other1.0%


MadisonClinton36.1%
 
Bush47.7%
 
Perot15.8%
 
Other0.4%


MarengoClinton50.1%
 
Bush39.8%
 
Perot8.2%
 
Other2.0%


MarionClinton46.5%
 
Bush42.9%
 
Perot10.5%
 
Other0.2%


MarshallClinton39.0%
 
Bush45.8%
 
Perot14.2%
 
Other0.9%


MobileClinton38.2%
 
Bush50.7%
 
Perot10.5%
 
Other0.5%


MonroeClinton39.7%
 
Bush50.5%
 
Perot7.8%
 
Other2.0%


MontgomeryClinton43.3%
 
Bush47.3%
 
Perot8.9%
 
Other0.5%


MorganClinton34.3%
 
Bush47.9%
 
Perot17.5%
 
Other0.3%


PerryClinton63.9%
 
Bush31.5%
 
Perot3.7%
 
Other1.0%


PickensClinton46.5%
 
Bush44.6%
 
Perot8.5%
 
Other0.4%


PikeClinton41.9%
 
Bush48.4%
 
Perot9.1%
 
Other0.5%


RandolphClinton40.7%
 
Bush46.8%
 
Perot11.3%
 
Other1.3%


RussellClinton55.1%
 
Bush35.6%
 
Perot8.7%
 
Other0.6%


St. ClairClinton30.1%
 
Bush57.6%
 
Perot12.1%
 
Other0.2%


ShelbyClinton21.4%
 
Bush68.0%
 
Perot10.4%
 
Other0.2%


SumterClinton68.5%
 
Bush25.7%
 
Perot5.5%
 
Other0.3%


TalladegaClinton40.7%
 
Bush48.2%
 
Perot10.0%
 
Other1.1%


TallapoosaClinton36.9%
 
Bush52.7%
 
Perot10.1%
 
Other0.3%


TuscaloosaClinton40.5%
 
Bush47.3%
 
Perot12.1%
 
Other0.2%


WalkerClinton50.2%
 
Bush38.3%
 
Perot11.3%
 
Other0.2%


WashingtonClinton49.6%
 
Bush40.1%
 
Perot10.2%
 
Other0.2%


WilcoxClinton64.8%
 
Bush31.5%
 
Perot3.3%
 
Other0.4%


WinstonClinton33.8%
 
Bush55.0%
 
Perot11.0%
 
Other0.1%


National DataGraph for 1992 - Alabama Results for 1992

Login

Terms of Use - DCMA Policy - Privacy Policy and Cookies


© Dave Leip's Atlas of U.S. Elections, LLC 2019 All Rights Reserved