1992 Presidential General Election Data Graphs - Illinois
Note: The Google advertisement links below may advocate political positions that this site does not endorse.
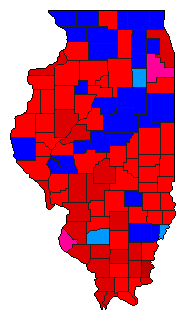
Map

AdamsClinton37.2%
 
Bush42.8%
 
Perot19.5%
 
Other0.5%


AlexanderClinton58.8%
 
Bush29.8%
 
Perot10.9%
 
Other0.5%


BondClinton45.4%
 
Bush36.0%
 
Perot18.2%
 
Other0.4%


BooneClinton37.5%
 
Bush41.0%
 
Perot21.1%
 
Other0.3%


BrownClinton42.6%
 
Bush38.3%
 
Perot18.7%
 
Other0.4%


BureauClinton42.2%
 
Bush38.2%
 
Perot19.3%
 
Other0.3%


CalhounClinton54.2%
 
Bush26.6%
 
Perot19.0%
 
Other0.2%


CarrollClinton37.2%
 
Bush42.9%
 
Perot19.6%
 
Other0.3%


CassClinton49.6%
 
Bush33.5%
 
Perot16.6%
 
Other0.2%


ChampaignClinton46.0%
 
Bush35.6%
 
Perot17.8%
 
Other0.6%


ChristianClinton51.4%
 
Bush28.9%
 
Perot19.3%
 
Other0.3%


ClarkClinton41.8%
 
Bush39.8%
 
Perot18.2%
 
Other0.2%


ClayClinton44.5%
 
Bush37.1%
 
Perot17.9%
 
Other0.4%


ClintonClinton42.3%
 
Bush36.5%
 
Perot21.0%
 
Other0.3%


ColesClinton42.2%
 
Bush36.3%
 
Perot21.1%
 
Other0.4%


CookClinton58.2%
 
Bush28.2%
 
Perot13.1%
 
Other0.5%


CrawfordClinton41.0%
 
Bush37.3%
 
Perot21.3%
 
Other0.4%


CumberlandClinton40.6%
 
Bush35.8%
 
Perot23.2%
 
Other0.4%


DeKalbClinton40.1%
 
Bush37.0%
 
Perot22.4%
 
Other0.4%


De WittClinton38.8%
 
Bush40.8%
 
Perot19.9%
 
Other0.6%


DouglasClinton40.4%
 
Bush40.0%
 
Perot19.3%
 
Other0.3%


DuPageClinton30.9%
 
Bush48.1%
 
Perot20.7%
 
Other0.4%


EdgarClinton41.1%
 
Bush38.8%
 
Perot19.7%
 
Other0.4%


EdwardsClinton36.6%
 
Bush45.1%
 
Perot17.8%
 
Other0.5%


EffinghamClinton34.9%
 
Bush42.2%
 
Perot22.4%
 
Other0.5%


FayetteClinton47.8%
 
Bush34.7%
 
Perot17.1%
 
Other0.5%


FordClinton33.6%
 
Bush47.0%
 
Perot18.9%
 
Other0.6%


FranklinClinton59.3%
 
Bush25.6%
 
Perot14.8%
 
Other0.2%


FultonClinton54.9%
 
Bush28.6%
 
Perot16.2%
 
Other0.2%


GallatinClinton60.1%
 
Bush25.1%
 
Perot14.4%
 
Other0.4%


GreeneClinton45.0%
 
Bush34.0%
 
Perot20.8%
 
Other0.2%


GrundyClinton37.6%
 
Bush39.0%
 
Perot22.9%
 
Other0.4%


HamiltonClinton51.9%
 
Bush30.6%
 
Perot17.3%
 
Other0.2%


HancockClinton41.8%
 
Bush36.9%
 
Perot20.8%
 
Other0.5%


HardinClinton52.5%
 
Bush31.0%
 
Perot16.2%
 
Other0.3%


HendersonClinton49.7%
 
Bush32.4%
 
Perot17.7%
 
Other0.2%


HenryClinton45.5%
 
Bush36.9%
 
Perot17.4%
 
Other0.3%


IroquoisClinton30.6%
 
Bush47.8%
 
Perot21.1%
 
Other0.5%


JacksonClinton54.7%
 
Bush28.2%
 
Perot16.4%
 
Other0.7%


JasperClinton41.7%
 
Bush36.4%
 
Perot21.2%
 
Other0.7%


JeffersonClinton49.2%
 
Bush31.2%
 
Perot19.3%
 
Other0.2%


JerseyClinton47.1%
 
Bush29.1%
 
Perot23.4%
 
Other0.5%


Jo DaviessClinton38.7%
 
Bush40.6%
 
Perot20.1%
 
Other0.6%


JohnsonClinton42.6%
 
Bush39.4%
 
Perot17.5%
 
Other0.4%


KaneClinton34.8%
 
Bush43.5%
 
Perot21.2%
 
Other0.4%


KankakeeClinton43.0%
 
Bush38.5%
 
Perot18.1%
 
Other0.4%


KendallClinton29.5%
 
Bush46.3%
 
Perot23.9%
 
Other0.4%


KnoxClinton49.5%
 
Bush32.9%
 
Perot17.2%
 
Other0.3%


LakeClinton36.5%
 
Bush44.2%
 
Perot18.9%
 
Other0.4%


LaSalleClinton46.6%
 
Bush32.2%
 
Perot20.9%
 
Other0.3%


LawrenceClinton43.7%
 
Bush35.8%
 
Perot20.0%
 
Other0.5%


LeeClinton35.9%
 
Bush43.1%
 
Perot20.7%
 
Other0.3%


LivingstonClinton35.1%
 
Bush46.8%
 
Perot17.7%
 
Other0.3%


LoganClinton36.4%
 
Bush46.3%
 
Perot17.0%
 
Other0.3%


McDonoughClinton41.8%
 
Bush38.0%
 
Perot19.9%
 
Other0.3%


McHenryClinton28.1%
 
Bush46.8%
 
Perot24.7%
 
Other0.4%


McLeanClinton38.9%
 
Bush43.4%
 
Perot17.3%
 
Other0.3%


MaconClinton49.4%
 
Bush33.6%
 
Perot16.6%
 
Other0.4%


MacoupinClinton50.9%
 
Bush27.5%
 
Perot21.2%
 
Other0.3%


MadisonClinton51.3%
 
Bush28.2%
 
Perot20.3%
 
Other0.3%


MarionClinton51.2%
 
Bush30.5%
 
Perot18.0%
 
Other0.2%


MarshallClinton43.4%
 
Bush38.3%
 
Perot18.0%
 
Other0.3%


MasonClinton51.5%
 
Bush32.1%
 
Perot16.2%
 
Other0.2%


MassacClinton47.4%
 
Bush39.0%
 
Perot12.6%
 
Other0.9%


MenardClinton35.9%
 
Bush45.0%
 
Perot18.7%
 
Other0.3%


MercerClinton46.7%
 
Bush34.9%
 
Perot18.0%
 
Other0.4%


MonroeClinton39.0%
 
Bush38.3%
 
Perot22.4%
 
Other0.2%


MontgomeryClinton50.0%
 
Bush29.7%
 
Perot19.9%
 
Other0.3%


MorganClinton39.0%
 
Bush40.3%
 
Perot20.4%
 
Other0.4%


MoultrieClinton47.3%
 
Bush31.9%
 
Perot20.4%
 
Other0.3%


OgleClinton32.4%
 
Bush44.8%
 
Perot22.2%
 
Other0.7%


PeoriaClinton46.8%
 
Bush37.8%
 
Perot15.0%
 
Other0.4%


PerryClinton54.2%
 
Bush28.0%
 
Perot17.6%
 
Other0.2%


PiattClinton41.7%
 
Bush36.4%
 
Perot21.6%
 
Other0.3%


PikeClinton44.4%
 
Bush37.0%
 
Perot18.2%
 
Other0.4%


PopeClinton44.1%
 
Bush39.4%
 
Perot16.2%
 
Other0.2%


PulaskiClinton56.0%
 
Bush32.9%
 
Perot10.7%
 
Other0.4%


PutnamClinton47.6%
 
Bush29.3%
 
Perot22.7%
 
Other0.4%


RandolphClinton51.5%
 
Bush29.6%
 
Perot18.7%
 
Other0.3%


RichlandClinton40.8%
 
Bush37.9%
 
Perot21.0%
 
Other0.4%


Rock IslandClinton51.9%
 
Bush32.2%
 
Perot14.5%
 
Other1.4%


St. ClairClinton53.6%
 
Bush29.7%
 
Perot16.4%
 
Other0.3%


SalineClinton54.8%
 
Bush27.7%
 
Perot17.4%
 
Other0.2%


SangamonClinton41.4%
 
Bush40.9%
 
Perot17.4%
 
Other0.3%


SchuylerClinton41.3%
 
Bush37.8%
 
Perot20.4%
 
Other0.5%


ScottClinton38.0%
 
Bush40.7%
 
Perot21.1%
 
Other0.2%


ShelbyClinton45.6%
 
Bush32.5%
 
Perot21.5%
 
Other0.4%


StarkClinton39.9%
 
Bush41.3%
 
Perot18.7%
 
Other0.2%


StephensonClinton36.5%
 
Bush41.6%
 
Perot21.6%
 
Other0.3%


TazewellClinton44.1%
 
Bush39.1%
 
Perot16.5%
 
Other0.3%


UnionClinton51.5%
 
Bush33.1%
 
Perot15.1%
 
Other0.3%


VermilionClinton47.8%
 
Bush30.4%
 
Perot21.2%
 
Other0.6%


WabashClinton39.0%
 
Bush39.8%
 
Perot20.9%
 
Other0.3%


WarrenClinton43.3%
 
Bush39.4%
 
Perot17.0%
 
Other0.3%


WashingtonClinton39.5%
 
Bush39.7%
 
Perot20.4%
 
Other0.3%


WayneClinton37.6%
 
Bush42.9%
 
Perot19.2%
 
Other0.3%


WhiteClinton48.9%
 
Bush34.7%
 
Perot16.2%
 
Other0.2%


WhitesideClinton45.4%
 
Bush37.4%
 
Perot16.9%
 
Other0.3%


WillClinton39.2%
 
Bush38.3%
 
Perot21.6%
 
Other0.9%


WilliamsonClinton49.9%
 
Bush32.9%
 
Perot16.6%
 
Other0.5%


WinnebagoClinton43.0%
 
Bush37.6%
 
Perot18.9%
 
Other0.4%


WoodfordClinton33.7%
 
Bush49.3%
 
Perot16.8%
 
Other0.3%


National DataGraph for 1992 - Illinois Results for 1992

Login

Terms of Use - DCMA Policy - Privacy Policy and Cookies


© Dave Leip's Atlas of U.S. Elections, LLC 2019 All Rights Reserved