1992 Presidential General Election Data Graphs - New Mexico
Note: The Google advertisement links below may advocate political positions that this site does not endorse.
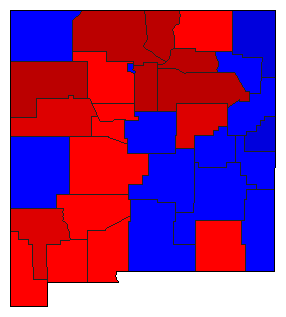
Map

BernalilloClinton45.3%
 
Bush38.5%
 
Perot15.6%
 
Other0.6%


CatronClinton29.9%
 
Bush49.6%
 
Perot18.6%
 
Other1.8%


ChavesClinton33.7%
 
Bush46.9%
 
Perot19.0%
 
Other0.4%


CibolaClinton53.1%
 
Bush32.6%
 
Perot13.5%
 
Other0.8%


ColfaxClinton49.9%
 
Bush33.1%
 
Perot16.7%
 
Other0.4%


CurryClinton29.3%
 
Bush54.1%
 
Perot16.3%
 
Other0.4%


De BacaClinton38.1%
 
Bush44.4%
 
Perot17.2%
 
Other0.3%


Dona AnaClinton45.0%
 
Bush36.9%
 
Perot17.4%
 
Other0.8%


EddyClinton40.7%
 
Bush40.2%
 
Perot18.8%
 
Other0.3%


GrantClinton54.5%
 
Bush28.4%
 
Perot16.4%
 
Other0.7%


GuadalupeClinton58.3%
 
Bush32.9%
 
Perot8.2%
 
Other0.6%


HardingClinton39.5%
 
Bush46.0%
 
Perot14.5%


HidalgoClinton43.0%
 
Bush37.6%
 
Perot19.1%
 
Other0.3%


LeaClinton30.9%
 
Bush48.6%
 
Perot19.8%
 
Other0.7%


LincolnClinton29.5%
 
Bush45.6%
 
Perot24.4%
 
Other0.5%


Los AlamosClinton36.6%
 
Bush40.6%
 
Perot22.0%
 
Other0.8%


LunaClinton42.0%
 
Bush34.5%
 
Perot23.0%
 
Other0.4%


McKinleyClinton60.6%
 
Bush30.4%
 
Perot8.4%
 
Other0.7%


MoraClinton64.2%
 
Bush27.6%
 
Perot7.8%
 
Other0.4%


OteroClinton33.2%
 
Bush46.2%
 
Perot20.1%
 
Other0.5%


QuayClinton41.0%
 
Bush41.0%
 
Perot17.6%
 
Other0.4%


Rio ArribaClinton67.9%
 
Bush23.2%
 
Perot8.5%
 
Other0.4%


RooseveltClinton33.3%
 
Bush49.4%
 
Perot16.7%
 
Other0.6%


SandovalClinton46.5%
 
Bush36.0%
 
Perot16.8%
 
Other0.8%


San JuanClinton37.3%
 
Bush44.3%
 
Perot17.7%
 
Other0.7%


San MiguelClinton65.9%
 
Bush23.3%
 
Perot10.3%
 
Other0.6%


Santa FeClinton63.4%
 
Bush22.6%
 
Perot13.2%
 
Other0.9%


SierraClinton40.1%
 
Bush35.4%
 
Perot23.9%
 
Other0.7%


SocorroClinton47.8%
 
Bush35.9%
 
Perot15.1%
 
Other1.2%


TaosClinton66.0%
 
Bush21.2%
 
Perot12.2%
 
Other0.7%


TorranceClinton39.9%
 
Bush40.0%
 
Perot19.4%
 
Other0.7%


UnionClinton28.0%
 
Bush52.6%
 
Perot19.1%
 
Other0.3%


ValenciaClinton44.7%
 
Bush37.6%
 
Perot17.3%
 
Other0.4%


National DataGraph for 1992 - New Mexico Results for 1992

Login

Terms of Use - DCMA Policy - Privacy Policy and Cookies


© Dave Leip's Atlas of U.S. Elections, LLC 2019 All Rights Reserved