1992 Gubernatorial Democratic Primary Election Data Graphs - West Virginia
Note: The Google advertisement links below may advocate political positions that this site does not endorse.
Data for this Contest was Contributed by on 2014-07-05
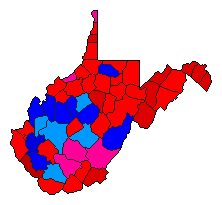
Map

BarbourCaperton49.4%
 
Pritt29.7%
 
Palumbo18.0%
 
Other2.8%


BerkeleyCaperton52.1%
 
Pritt30.9%
 
Palumbo12.9%
 
Other4.1%


BooneCaperton42.7%
 
Pritt39.7%
 
Palumbo16.4%
 
Other1.1%


BraxtonCaperton39.3%
 
Pritt41.2%
 
Palumbo14.2%
 
Other5.3%


BrookeCaperton41.8%
 
Pritt24.6%
 
Palumbo29.9%
 
Other3.7%


CabellCaperton47.5%
 
Pritt34.7%
 
Palumbo16.2%
 
Other1.7%


CalhounCaperton35.0%
 
Pritt42.8%
 
Palumbo19.1%
 
Other3.1%


ClayCaperton42.6%
 
Pritt39.5%
 
Palumbo15.6%
 
Other2.4%


DoddridgeCaperton43.2%
 
Pritt39.8%
 
Palumbo13.4%
 
Other3.7%


FayetteCaperton37.5%
 
Pritt36.4%
 
Palumbo24.5%
 
Other1.6%


GilmerCaperton36.8%
 
Pritt39.7%
 
Palumbo17.5%
 
Other6.0%


GrantCaperton59.1%
 
Pritt27.3%
 
Palumbo6.9%
 
Other6.7%


GreenbrierCaperton37.8%
 
Pritt35.0%
 
Palumbo24.8%
 
Other2.4%


HampshireCaperton45.3%
 
Pritt37.7%
 
Palumbo9.9%
 
Other7.1%


HancockCaperton39.6%
 
Pritt26.0%
 
Palumbo29.7%
 
Other4.7%


HardyCaperton47.4%
 
Pritt35.6%
 
Palumbo10.7%
 
Other6.2%


HarrisonCaperton48.9%
 
Pritt35.1%
 
Palumbo13.8%
 
Other2.2%


JacksonCaperton40.4%
 
Pritt42.4%
 
Palumbo15.8%
 
Other1.4%


JeffersonCaperton52.0%
 
Pritt32.1%
 
Palumbo12.7%
 
Other3.1%


KanawhaCaperton35.2%
 
Pritt35.3%
 
Palumbo28.5%
 
Other0.9%


LewisCaperton54.2%
 
Pritt24.6%
 
Palumbo17.7%
 
Other3.5%


LincolnCaperton39.1%
 
Pritt50.6%
 
Palumbo9.5%
 
Other0.8%


LoganCaperton40.0%
 
Pritt43.8%
 
Palumbo12.7%
 
Other3.5%


McDowellCaperton49.4%
 
Pritt29.9%
 
Palumbo18.0%
 
Other2.7%


MarionCaperton39.2%
 
Pritt44.6%
 
Palumbo13.8%
 
Other2.5%


MarshallCaperton46.7%
 
Pritt29.5%
 
Palumbo20.8%
 
Other3.0%


MasonCaperton40.2%
 
Pritt43.8%
 
Palumbo14.4%
 
Other1.5%


MercerCaperton49.5%
 
Pritt24.1%
 
Palumbo24.1%
 
Other2.3%


MineralCaperton55.3%
 
Pritt27.0%
 
Palumbo12.3%
 
Other5.3%


MingoCaperton60.4%
 
Pritt19.8%
 
Palumbo18.3%
 
Other1.4%


MonongaliaCaperton41.2%
 
Pritt38.1%
 
Palumbo18.2%
 
Other2.6%


MonroeCaperton52.7%
 
Pritt22.7%
 
Palumbo22.5%
 
Other2.1%


MorganCaperton53.0%
 
Pritt20.5%
 
Palumbo21.3%
 
Other5.2%


NicholasCaperton35.4%
 
Pritt39.4%
 
Palumbo22.1%
 
Other3.1%


OhioCaperton50.2%
 
Pritt24.2%
 
Palumbo23.2%
 
Other2.4%


PendletonCaperton59.3%
 
Pritt17.5%
 
Palumbo16.9%
 
Other6.2%


PleasantsCaperton39.5%
 
Pritt32.8%
 
Palumbo22.1%
 
Other5.6%


PocahontasCaperton37.9%
 
Pritt42.9%
 
Palumbo17.1%
 
Other2.1%


PrestonCaperton43.0%
 
Pritt35.5%
 
Palumbo17.4%
 
Other4.1%


PutnamCaperton32.9%
 
Pritt36.9%
 
Palumbo28.7%
 
Other1.6%


RaleighCaperton35.6%
 
Pritt32.4%
 
Palumbo30.3%
 
Other1.6%


RandolphCaperton44.7%
 
Pritt34.4%
 
Palumbo18.7%
 
Other2.2%


RitchieCaperton44.1%
 
Pritt33.4%
 
Palumbo17.5%
 
Other4.9%


RoaneCaperton37.0%
 
Pritt47.1%
 
Palumbo15.0%
 
Other1.0%


SummersCaperton43.6%
 
Pritt28.5%
 
Palumbo26.1%
 
Other1.8%


TaylorCaperton40.0%
 
Pritt38.4%
 
Palumbo19.1%
 
Other2.5%


TuckerCaperton49.0%
 
Pritt27.3%
 
Palumbo20.2%
 
Other3.4%


TylerCaperton46.6%
 
Pritt27.5%
 
Palumbo22.3%
 
Other3.7%


UpshurCaperton48.5%
 
Pritt34.6%
 
Palumbo13.5%
 
Other3.4%


WayneCaperton43.1%
 
Pritt42.1%
 
Palumbo12.8%
 
Other2.0%


WebsterCaperton43.0%
 
Pritt33.5%
 
Palumbo18.7%
 
Other4.8%


WetzelCaperton48.0%
 
Pritt26.4%
 
Palumbo22.2%
 
Other3.4%


WirtCaperton42.9%
 
Pritt38.1%
 
Palumbo14.7%
 
Other4.3%


WoodCaperton41.1%
 
Pritt29.8%
 
Palumbo22.9%
 
Other6.2%


WyomingCaperton34.3%
 
Pritt37.1%
 
Palumbo26.7%
 
Other1.9%


National DataGraph for 1992 - West Virginia Results for 1992

Login

Terms of Use - DCMA Policy - Privacy Policy and Cookies


© Dave Leip's Atlas of U.S. Elections, LLC 2019 All Rights Reserved