1994 Insurance Commissioner General Election Data Graphs - California
Note: The Google advertisement links below may advocate political positions that this site does not endorse.
Data for this Contest was Contributed by on 2007-02-08
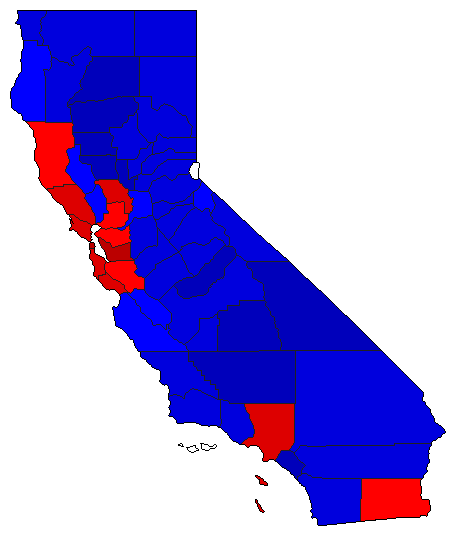
Map

AlamedaTorres62.7%
 
Quackenbush29.7%
 
Other7.5%


AlpineTorres36.2%
 
Quackenbush47.6%
 
Other16.2%


AmadorTorres36.0%
 
Quackenbush56.2%
 
Other7.8%


ButteTorres32.2%
 
Quackenbush59.9%
 
Other8.0%


CalaverasTorres34.5%
 
Quackenbush55.7%
 
Other9.8%


ColusaTorres28.6%
 
Quackenbush65.1%
 
Other6.3%


Contra CostaTorres49.7%
 
Quackenbush43.1%
 
Other7.2%


Del NorteTorres34.5%
 
Quackenbush55.7%
 
Other9.7%


El DoradoTorres32.4%
 
Quackenbush58.6%
 
Other9.0%


FresnoTorres36.8%
 
Quackenbush56.6%
 
Other6.6%


GlennTorres24.2%
 
Quackenbush69.4%
 
Other6.4%


HumboldtTorres42.0%
 
Quackenbush47.8%
 
Other10.2%


ImperialTorres46.4%
 
Quackenbush43.9%
 
Other9.7%


InyoTorres27.4%
 
Quackenbush65.1%
 
Other7.5%


KernTorres29.3%
 
Quackenbush63.2%
 
Other7.5%


KingsTorres36.4%
 
Quackenbush56.7%
 
Other6.9%


LakeTorres44.5%
 
Quackenbush46.7%
 
Other8.8%


LassenTorres34.1%
 
Quackenbush52.7%
 
Other13.1%


Los AngelesTorres50.2%
 
Quackenbush43.0%
 
Other6.8%


MaderaTorres31.6%
 
Quackenbush60.9%
 
Other7.5%


MarinTorres56.5%
 
Quackenbush36.2%
 
Other7.3%


MariposaTorres33.4%
 
Quackenbush57.0%
 
Other9.6%


MendocinoTorres48.2%
 
Quackenbush38.5%
 
Other13.3%


MercedTorres36.1%
 
Quackenbush55.3%
 
Other8.6%


ModocTorres29.0%
 
Quackenbush56.1%
 
Other14.8%


MonoTorres32.6%
 
Quackenbush57.3%
 
Other10.1%


MontereyTorres43.5%
 
Quackenbush47.9%
 
Other8.7%


NapaTorres44.0%
 
Quackenbush48.0%
 
Other8.0%


NevadaTorres32.7%
 
Quackenbush58.6%
 
Other8.7%


OrangeTorres29.6%
 
Quackenbush63.0%
 
Other7.4%


PlacerTorres32.7%
 
Quackenbush59.0%
 
Other8.3%


PlumasTorres35.2%
 
Quackenbush55.1%
 
Other9.7%


RiversideTorres35.0%
 
Quackenbush56.8%
 
Other8.2%


SacramentoTorres43.6%
 
Quackenbush48.3%
 
Other8.1%


San BenitoTorres42.4%
 
Quackenbush48.4%
 
Other9.1%


San BernardinoTorres35.8%
 
Quackenbush55.9%
 
Other8.3%


San DiegoTorres34.5%
 
Quackenbush56.6%
 
Other8.9%


San FranciscoTorres68.9%
 
Quackenbush22.6%
 
Other8.5%


San JoaquinTorres38.8%
 
Quackenbush54.5%
 
Other6.7%


San Luis ObispoTorres32.4%
 
Quackenbush59.0%
 
Other8.5%


San MateoTorres53.0%
 
Quackenbush40.4%
 
Other6.7%


Santa BarbaraTorres38.0%
 
Quackenbush54.4%
 
Other7.6%


Santa ClaraTorres46.4%
 
Quackenbush45.3%
 
Other8.3%


Santa CruzTorres51.2%
 
Quackenbush38.0%
 
Other10.8%


ShastaTorres27.0%
 
Quackenbush64.0%
 
Other9.0%


SierraTorres35.2%
 
Quackenbush52.4%
 
Other12.4%


SiskiyouTorres36.4%
 
Quackenbush51.3%
 
Other12.3%


SolanoTorres47.3%
 
Quackenbush43.9%
 
Other8.8%


SonomaTorres51.8%
 
Quackenbush38.9%
 
Other9.3%


StanislausTorres39.8%
 
Quackenbush50.4%
 
Other9.8%


SutterTorres26.7%
 
Quackenbush66.7%
 
Other6.6%


TehamaTorres29.1%
 
Quackenbush62.0%
 
Other8.9%


TrinityTorres34.0%
 
Quackenbush50.3%
 
Other15.7%


TulareTorres31.8%
 
Quackenbush61.6%
 
Other6.7%


TuolumneTorres37.7%
 
Quackenbush54.3%
 
Other7.9%


VenturaTorres36.0%
 
Quackenbush56.4%
 
Other7.6%


YoloTorres51.4%
 
Quackenbush40.5%
 
Other8.1%


YubaTorres31.4%
 
Quackenbush58.6%
 
Other10.0%


National DataGraph for 1994 - California Results for 1994

Login

Terms of Use - DCMA Policy - Privacy Policy and Cookies


© Dave Leip's Atlas of U.S. Elections, LLC 2019 All Rights Reserved