1996 Presidential General Election Data Graphs - Pennsylvania
Note: The Google advertisement links below may advocate political positions that this site does not endorse.
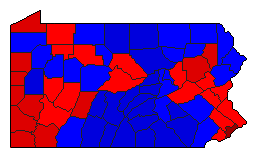
Map

AdamsClinton36.5%
 
Dole52.0%
 
Perot10.8%
 
Other0.7%


AlleghenyClinton52.8%
 
Dole37.9%
 
Perot7.9%
 
Other1.4%


ArmstrongClinton43.2%
 
Dole42.9%
 
Perot13.4%
 
Other0.6%


BeaverClinton53.3%
 
Dole35.1%
 
Perot11.1%
 
Other0.5%


BedfordClinton32.8%
 
Dole55.5%
 
Perot11.3%
 
Other0.4%


BerksClinton41.0%
 
Dole46.2%
 
Perot11.3%
 
Other1.4%


BlairClinton37.0%
 
Dole52.3%
 
Perot9.9%
 
Other0.9%


BradfordClinton36.8%
 
Dole49.5%
 
Perot12.9%
 
Other0.8%


BucksClinton45.4%
 
Dole41.7%
 
Perot10.8%
 
Other2.0%


ButlerClinton36.3%
 
Dole52.9%
 
Perot10.1%
 
Other0.7%


CambriaClinton51.3%
 
Dole34.3%
 
Perot13.2%
 
Other1.2%


CameronClinton36.8%
 
Dole49.9%
 
Perot12.7%
 
Other0.6%


CarbonClinton47.7%
 
Dole36.3%
 
Perot15.1%
 
Other0.9%


CentreClinton45.2%
 
Dole44.7%
 
Perot8.9%
 
Other1.2%


ChesterClinton40.9%
 
Dole48.6%
 
Perot8.9%
 
Other1.6%


ClarionClinton39.5%
 
Dole45.9%
 
Perot13.7%
 
Other0.9%


ClearfieldClinton41.4%
 
Dole44.9%
 
Perot13.0%
 
Other0.8%


ClintonClinton49.3%
 
Dole37.4%
 
Perot12.4%
 
Other0.9%


ColumbiaClinton41.1%
 
Dole40.4%
 
Perot17.9%
 
Other0.5%


CrawfordClinton41.2%
 
Dole46.6%
 
Perot11.2%
 
Other1.0%


CumberlandClinton36.4%
 
Dole55.6%
 
Perot7.2%
 
Other0.8%


DauphinClinton44.0%
 
Dole47.8%
 
Perot7.5%
 
Other0.7%


DelawareClinton49.4%
 
Dole39.5%
 
Perot9.3%
 
Other1.8%


ElkClinton44.2%
 
Dole37.6%
 
Perot17.6%
 
Other0.6%


ErieClinton52.9%
 
Dole36.7%
 
Perot9.5%
 
Other0.9%


FayetteClinton56.6%
 
Dole30.1%
 
Perot12.3%
 
Other0.9%


ForestClinton43.8%
 
Dole41.0%
 
Perot14.8%
 
Other0.5%


FranklinClinton33.5%
 
Dole56.8%
 
Perot9.2%
 
Other0.5%


FultonClinton33.3%
 
Dole54.7%
 
Perot11.4%
 
Other0.6%


GreeneClinton55.5%
 
Dole29.1%
 
Perot14.9%
 
Other0.5%


HuntingdonClinton36.5%
 
Dole50.5%
 
Perot12.5%
 
Other0.5%


IndianaClinton45.3%
 
Dole42.1%
 
Perot12.0%
 
Other0.5%


JeffersonClinton35.5%
 
Dole49.6%
 
Perot14.1%
 
Other0.8%


JuniataClinton36.3%
 
Dole51.7%
 
Perot11.4%
 
Other0.6%


LackawannaClinton56.1%
 
Dole32.6%
 
Perot9.9%
 
Other1.4%


LancasterClinton31.6%
 
Dole59.8%
 
Perot7.5%
 
Other1.1%


LawrenceClinton52.4%
 
Dole36.1%
 
Perot11.0%
 
Other0.5%


LebanonClinton34.8%
 
Dole53.7%
 
Perot10.4%
 
Other1.1%


LehighClinton45.8%
 
Dole42.5%
 
Perot10.3%
 
Other1.4%


LuzerneClinton51.5%
 
Dole37.3%
 
Perot10.6%
 
Other0.5%


LycomingClinton34.4%
 
Dole54.9%
 
Perot9.8%
 
Other0.9%


McKeanClinton37.1%
 
Dole46.0%
 
Perot15.8%
 
Other1.2%


MercerClinton50.2%
 
Dole37.6%
 
Perot11.2%
 
Other1.0%


MifflinClinton38.8%
 
Dole50.2%
 
Perot10.1%
 
Other0.8%


MonroeClinton42.4%
 
Dole44.4%
 
Perot11.9%
 
Other1.4%


MontgomeryClinton48.9%
 
Dole41.2%
 
Perot8.3%
 
Other1.7%


MontourClinton37.6%
 
Dole47.9%
 
Perot13.5%
 
Other1.0%


NorthamptonClinton48.3%
 
Dole39.3%
 
Perot10.8%
 
Other1.6%


NorthumberlandClinton41.4%
 
Dole41.8%
 
Perot16.0%
 
Other0.8%


PerryClinton31.8%
 
Dole56.2%
 
Perot11.1%
 
Other1.0%


PhiladelphiaClinton77.4%
 
Dole16.0%
 
Perot5.5%
 
Other1.1%


PikeClinton38.7%
 
Dole47.0%
 
Perot13.1%
 
Other1.2%


PotterClinton31.5%
 
Dole54.5%
 
Perot13.6%
 
Other0.5%


SchuylkillClinton43.9%
 
Dole40.5%
 
Perot15.0%
 
Other0.7%


SnyderClinton29.2%
 
Dole57.9%
 
Perot12.5%
 
Other0.4%


SomersetClinton40.3%
 
Dole46.6%
 
Perot12.6%
 
Other0.5%


SullivanClinton37.5%
 
Dole47.3%
 
Perot14.6%
 
Other0.6%


SusquehannaClinton37.8%
 
Dole47.0%
 
Perot14.5%
 
Other0.7%


TiogaClinton34.4%
 
Dole51.2%
 
Perot13.8%
 
Other0.6%


UnionClinton31.2%
 
Dole56.0%
 
Perot12.2%
 
Other0.6%


VenangoClinton42.0%
 
Dole43.0%
 
Perot14.2%
 
Other0.9%


WarrenClinton42.7%
 
Dole41.3%
 
Perot14.7%
 
Other1.3%


WashingtonClinton52.7%
 
Dole35.7%
 
Perot11.1%
 
Other0.5%


WayneClinton36.3%
 
Dole49.4%
 
Perot13.0%
 
Other1.2%


WestmorelandClinton44.4%
 
Dole43.3%
 
Perot11.3%
 
Other0.9%


WyomingClinton38.9%
 
Dole47.0%
 
Perot13.6%
 
Other0.5%


YorkClinton38.7%
 
Dole50.9%
 
Perot9.1%
 
Other1.3%


National DataGraph for 1996 - Pennsylvania Results for 1996

Login

Terms of Use - DCMA Policy - Privacy Policy and Cookies


© Dave Leip's Atlas of U.S. Elections, LLC 2019 All Rights Reserved