1996 Gubernatorial Democratic Primary Election Data Graphs - Washington
Note: The Google advertisement links below may advocate political positions that this site does not endorse.
Data for this Contest was Contributed by on 2010-07-30
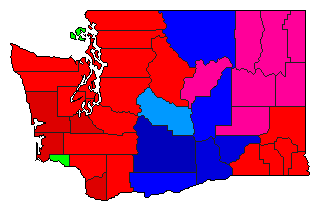
Map

AdamsLocke37.6%
 
Inslee37.1%
 
Rice20.1%
 
Other5.1%


AsotinLocke48.2%
 
Inslee18.5%
 
Rice29.5%
 
Other3.8%


BentonLocke35.8%
 
Inslee53.2%
 
Rice9.3%
 
Other1.7%


ChelanLocke41.3%
 
Inslee28.9%
 
Rice28.5%
 
Other1.3%


ClallamLocke45.8%
 
Inslee12.3%
 
Rice40.2%
 
Other1.7%


ClarkLocke54.7%
 
Inslee11.9%
 
Rice26.9%
 
Other6.4%


ColumbiaLocke42.6%
 
Inslee35.9%
 
Rice18.2%
 
Other3.3%


CowlitzLocke47.7%
 
Inslee11.7%
 
Rice29.4%
 
Other11.2%


DouglasLocke39.3%
 
Inslee36.0%
 
Rice23.3%
 
Other1.4%


FerryLocke39.0%
 
Inslee27.2%
 
Rice26.4%
 
Other7.5%


FranklinLocke35.1%
 
Inslee50.8%
 
Rice11.6%
 
Other2.5%


GarfieldLocke49.3%
 
Inslee29.9%
 
Rice13.4%
 
Other7.5%


GrantLocke32.7%
 
Inslee41.9%
 
Rice22.2%
 
Other3.1%


Grays HarborLocke56.3%
 
Inslee11.7%
 
Rice30.7%
 
Other1.3%


IslandLocke45.2%
 
Inslee13.9%
 
Rice39.5%
 
Other1.4%


JeffersonLocke48.4%
 
Inslee13.4%
 
Rice36.7%
 
Other1.5%


KingLocke46.2%
 
Inslee15.9%
 
Rice36.6%
 
Other1.3%


KitsapLocke48.6%
 
Inslee13.0%
 
Rice37.3%
 
Other1.0%


KittitasLocke31.3%
 
Inslee40.0%
 
Rice27.8%
 
Other0.9%


KlickitatLocke23.5%
 
Inslee40.4%
 
Rice32.0%
 
Other4.1%


LewisLocke48.2%
 
Inslee16.3%
 
Rice32.6%
 
Other2.9%


LincolnLocke33.9%
 
Inslee32.8%
 
Rice29.2%
 
Other4.2%


MasonLocke49.5%
 
Inslee17.1%
 
Rice32.0%
 
Other1.4%


OkanoganLocke29.2%
 
Inslee49.6%
 
Rice18.3%
 
Other2.9%


PacificLocke51.0%
 
Inslee10.5%
 
Rice33.9%
 
Other4.6%


Pend OreilleLocke39.1%
 
Inslee31.3%
 
Rice24.6%
 
Other5.0%


PierceLocke45.5%
 
Inslee14.8%
 
Rice38.2%
 
Other1.5%


San JuanLocke38.9%
 
Inslee13.5%
 
Rice46.4%
 
Other1.3%


SkagitLocke48.0%
 
Inslee15.3%
 
Rice35.3%
 
Other1.4%


SkamaniaLocke44.9%
 
Inslee18.3%
 
Rice24.3%
 
Other12.5%


SnohomishLocke48.9%
 
Inslee13.9%
 
Rice35.8%
 
Other1.4%


SpokaneLocke39.6%
 
Inslee22.3%
 
Rice35.6%
 
Other2.6%


StevensLocke39.6%
 
Inslee27.3%
 
Rice28.9%
 
Other4.2%


ThurstonLocke53.4%
 
Inslee15.3%
 
Rice30.1%
 
Other1.3%


WahkiakumLocke34.1%
 
Inslee13.0%
 
Rice44.5%
 
Other8.4%


Walla WallaLocke47.3%
 
Inslee31.6%
 
Rice19.1%
 
Other2.1%


WhatcomLocke45.9%
 
Inslee16.2%
 
Rice36.7%
 
Other1.1%


WhitmanLocke41.8%
 
Inslee24.4%
 
Rice31.4%
 
Other2.4%


YakimaLocke22.7%
 
Inslee69.2%
 
Rice6.7%
 
Other1.4%


National DataGraph for 1996 - Washington Results for 1996

Login

Terms of Use - DCMA Policy - Privacy Policy and Cookies


© Dave Leip's Atlas of U.S. Elections, LLC 2019 All Rights Reserved