1998 Lt. Gubernatorial General Election Data Graphs - California
Note: The Google advertisement links below may advocate political positions that this site does not endorse.
Data for this Contest was Contributed by on 2007-01-19
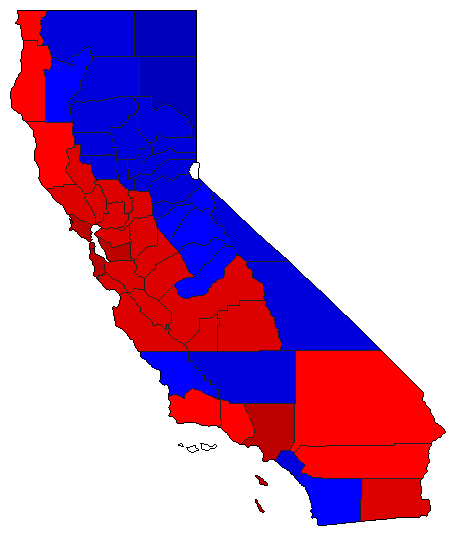
Map

AlamedaBustamante64.6%
 
Leslie23.8%
 
Other11.6%


AlpineBustamante37.2%
 
Leslie48.8%
 
Other14.1%


AmadorBustamante40.5%
 
Leslie53.9%
 
Other5.6%


ButteBustamante36.3%
 
Leslie55.4%
 
Other8.3%


CalaverasBustamante35.9%
 
Leslie49.0%
 
Other15.1%


ColusaBustamante36.3%
 
Leslie56.5%
 
Other7.2%


Contra CostaBustamante55.7%
 
Leslie36.2%
 
Other8.1%


Del NorteBustamante45.5%
 
Leslie42.0%
 
Other12.5%


El DoradoBustamante36.1%
 
Leslie57.6%
 
Other6.3%


FresnoBustamante55.9%
 
Leslie39.8%
 
Other4.3%


GlennBustamante32.8%
 
Leslie59.7%
 
Other7.5%


HumboldtBustamante46.5%
 
Leslie34.0%
 
Other19.5%


ImperialBustamante53.2%
 
Leslie36.9%
 
Other9.9%


InyoBustamante35.9%
 
Leslie54.5%
 
Other9.6%


KernBustamante40.3%
 
Leslie52.7%
 
Other7.0%


KingsBustamante52.4%
 
Leslie41.6%
 
Other6.1%


LakeBustamante52.9%
 
Leslie36.6%
 
Other10.5%


LassenBustamante30.4%
 
Leslie61.9%
 
Other7.6%


Los AngelesBustamante62.1%
 
Leslie30.7%
 
Other7.3%


MaderaBustamante46.1%
 
Leslie48.9%
 
Other5.0%


MarinBustamante60.8%
 
Leslie29.1%
 
Other10.1%


MariposaBustamante41.3%
 
Leslie49.7%
 
Other9.0%


MendocinoBustamante48.5%
 
Leslie32.4%
 
Other19.0%


MercedBustamante56.3%
 
Leslie38.4%
 
Other5.3%


ModocBustamante27.3%
 
Leslie62.8%
 
Other9.9%


MonoBustamante35.1%
 
Leslie55.8%
 
Other9.1%


MontereyBustamante54.2%
 
Leslie36.7%
 
Other9.2%


NapaBustamante51.7%
 
Leslie38.1%
 
Other10.3%


NevadaBustamante36.7%
 
Leslie55.1%
 
Other8.2%


OrangeBustamante39.4%
 
Leslie53.0%
 
Other7.7%


PlacerBustamante35.4%
 
Leslie59.4%
 
Other5.2%


PlumasBustamante33.6%
 
Leslie59.7%
 
Other6.7%


RiversideBustamante46.7%
 
Leslie45.6%
 
Other7.7%


SacramentoBustamante50.8%
 
Leslie42.6%
 
Other6.6%


San BenitoBustamante51.9%
 
Leslie38.5%
 
Other9.6%


San BernardinoBustamante49.0%
 
Leslie43.1%
 
Other7.8%


San DiegoBustamante43.7%
 
Leslie47.3%
 
Other9.0%


San FranciscoBustamante67.9%
 
Leslie15.2%
 
Other16.9%


San JoaquinBustamante50.3%
 
Leslie43.3%
 
Other6.3%


San Luis ObispoBustamante44.7%
 
Leslie46.7%
 
Other8.6%


San MateoBustamante61.7%
 
Leslie29.4%
 
Other8.9%


Santa BarbaraBustamante47.5%
 
Leslie43.1%
 
Other9.5%


Santa ClaraBustamante55.7%
 
Leslie34.7%
 
Other9.6%


Santa CruzBustamante56.2%
 
Leslie28.2%
 
Other15.7%


ShastaBustamante35.9%
 
Leslie54.7%
 
Other9.5%


SierraBustamante30.1%
 
Leslie59.3%
 
Other10.6%


SiskiyouBustamante38.0%
 
Leslie51.7%
 
Other10.3%


SolanoBustamante57.3%
 
Leslie34.1%
 
Other8.7%


SonomaBustamante56.7%
 
Leslie30.6%
 
Other12.7%


StanislausBustamante50.6%
 
Leslie43.6%
 
Other5.8%


SutterBustamante34.6%
 
Leslie59.6%
 
Other5.8%


TehamaBustamante38.2%
 
Leslie51.8%
 
Other10.0%


TrinityBustamante38.1%
 
Leslie46.8%
 
Other15.1%


TulareBustamante50.1%
 
Leslie45.2%
 
Other4.7%


TuolumneBustamante44.8%
 
Leslie47.5%
 
Other7.7%


VenturaBustamante46.7%
 
Leslie44.9%
 
Other8.4%


YoloBustamante56.2%
 
Leslie34.0%
 
Other9.7%


YubaBustamante38.8%
 
Leslie53.8%
 
Other7.4%


National DataGraph for 1998 - California Results for 1998

Login

Terms of Use - DCMA Policy - Privacy Policy and Cookies


© Dave Leip's Atlas of U.S. Elections, LLC 2019 All Rights Reserved