2000 Attorney General General Election Data Graphs - North Carolina
Note: The Google advertisement links below may advocate political positions that this site does not endorse.
Data for this Contest was Contributed by on 2011-05-20
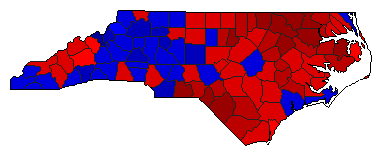
Map

AlamanceCooper46.8%
 
Boyce51.1%
 
Other2.2%


AlexanderCooper38.7%
 
Boyce59.5%
 
Other1.9%


AlleghanyCooper51.1%
 
Boyce45.6%
 
Other3.2%


AnsonCooper70.6%
 
Boyce26.2%
 
Other3.1%


AsheCooper43.2%
 
Boyce53.5%
 
Other3.4%


AveryCooper27.1%
 
Boyce67.6%
 
Other5.3%


BeaufortCooper51.5%
 
Boyce46.5%
 
Other2.1%


BertieCooper76.2%
 
Boyce23.3%
 
Other0.5%


BladenCooper68.9%
 
Boyce30.3%
 
Other0.8%


BrunswickCooper50.4%
 
Boyce46.2%
 
Other3.4%


BuncombeCooper48.8%
 
Boyce47.1%
 
Other4.1%


BurkeCooper45.5%
 
Boyce52.2%
 
Other2.2%


CabarrusCooper40.5%
 
Boyce56.4%
 
Other3.1%


CaldwellCooper38.9%
 
Boyce58.3%
 
Other2.8%


CamdenCooper51.2%
 
Boyce45.8%
 
Other2.9%


CarteretCooper43.5%
 
Boyce53.6%
 
Other2.9%


CaswellCooper59.7%
 
Boyce38.5%
 
Other1.7%


CatawbaCooper36.5%
 
Boyce60.9%
 
Other2.6%


ChathamCooper59.4%
 
Boyce38.2%
 
Other2.4%


CherokeeCooper39.4%
 
Boyce60.0%
 
Other0.6%


ChowanCooper61.8%
 
Boyce36.6%
 
Other1.6%


ClayCooper38.6%
 
Boyce58.9%
 
Other2.5%


ClevelandCooper50.6%
 
Boyce46.8%
 
Other2.6%


ColumbusCooper66.9%
 
Boyce30.4%
 
Other2.7%


CravenCooper50.0%
 
Boyce47.3%
 
Other2.7%


CumberlandCooper58.1%
 
Boyce39.4%
 
Other2.5%


CurrituckCooper43.2%
 
Boyce52.6%
 
Other4.2%


DareCooper48.1%
 
Boyce47.3%
 
Other4.6%


DavidsonCooper42.1%
 
Boyce55.5%
 
Other2.4%


DavieCooper34.2%
 
Boyce62.9%
 
Other2.9%


DuplinCooper57.2%
 
Boyce41.0%
 
Other1.9%


DurhamCooper70.1%
 
Boyce27.9%
 
Other2.0%


EdgecombeCooper78.5%
 
Boyce20.5%
 
Other1.0%


ForsythCooper50.2%
 
Boyce47.3%
 
Other2.5%


FranklinCooper58.4%
 
Boyce39.7%
 
Other1.9%


GastonCooper39.3%
 
Boyce57.8%
 
Other2.9%


GatesCooper64.9%
 
Boyce33.4%
 
Other1.7%


GrahamCooper37.0%
 
Boyce54.6%
 
Other8.4%


GranvilleCooper64.2%
 
Boyce34.3%
 
Other1.5%


GreeneCooper61.9%
 
Boyce36.7%
 
Other1.4%


GuilfordCooper55.4%
 
Boyce42.5%
 
Other2.1%


HalifaxCooper75.8%
 
Boyce22.5%
 
Other1.7%


HarnettCooper50.7%
 
Boyce46.6%
 
Other2.7%


HaywoodCooper52.7%
 
Boyce44.0%
 
Other3.3%


HendersonCooper36.1%
 
Boyce62.5%
 
Other1.4%


HertfordCooper76.4%
 
Boyce22.4%
 
Other1.2%


HokeCooper67.2%
 
Boyce31.0%
 
Other1.9%


HydeCooper66.8%
 
Boyce32.3%
 
Other0.9%


IredellCooper40.5%
 
Boyce56.8%
 
Other2.7%


JacksonCooper53.0%
 
Boyce43.9%
 
Other3.1%


JohnstonCooper46.7%
 
Boyce51.1%
 
Other2.2%


JonesCooper60.5%
 
Boyce38.3%
 
Other1.2%


LeeCooper56.1%
 
Boyce41.5%
 
Other2.4%


LenoirCooper60.2%
 
Boyce39.3%
 
Other0.5%


LincolnCooper41.1%
 
Boyce56.0%
 
Other2.9%


McDowellCooper40.9%
 
Boyce55.5%
 
Other3.6%


MaconCooper42.3%
 
Boyce55.8%
 
Other1.8%


MadisonCooper51.1%
 
Boyce47.1%
 
Other1.8%


MartinCooper68.4%
 
Boyce30.1%
 
Other1.4%


MecklenburgCooper51.2%
 
Boyce46.9%
 
Other1.9%


MitchellCooper25.0%
 
Boyce71.6%
 
Other3.4%


MontgomeryCooper55.9%
 
Boyce41.3%
 
Other2.9%


MooreCooper43.2%
 
Boyce56.4%
 
Other0.5%


NashCooper69.3%
 
Boyce29.8%
 
Other0.9%


New HanoverCooper48.4%
 
Boyce48.2%
 
Other3.4%


NorthamptonCooper78.0%
 
Boyce20.3%
 
Other1.7%


OnslowCooper43.2%
 
Boyce52.1%
 
Other4.8%


OrangeCooper67.5%
 
Boyce30.0%
 
Other2.5%


PamlicoCooper50.9%
 
Boyce46.4%
 
Other2.7%


PasquotankCooper59.4%
 
Boyce37.8%
 
Other2.8%


PenderCooper50.5%
 
Boyce47.2%
 
Other2.3%


PerquimansCooper56.1%
 
Boyce41.3%
 
Other2.6%


PersonCooper56.8%
 
Boyce41.0%
 
Other2.2%


PittCooper57.4%
 
Boyce42.0%
 
Other0.6%


PolkCooper40.2%
 
Boyce56.5%
 
Other3.2%


RandolphCooper36.5%
 
Boyce61.2%
 
Other2.3%


RichmondCooper64.7%
 
Boyce30.0%
 
Other5.4%


RobesonCooper72.1%
 
Boyce25.2%
 
Other2.7%


RockinghamCooper52.3%
 
Boyce44.3%
 
Other3.4%


RowanCooper41.6%
 
Boyce55.1%
 
Other3.3%


RutherfordCooper44.9%
 
Boyce51.6%
 
Other3.5%


SampsonCooper53.9%
 
Boyce44.7%
 
Other1.4%


ScotlandCooper70.0%
 
Boyce28.6%
 
Other1.4%


StanlyCooper42.0%
 
Boyce55.0%
 
Other3.1%


StokesCooper39.2%
 
Boyce58.4%
 
Other2.4%


SurryCooper43.9%
 
Boyce54.1%
 
Other2.0%


SwainCooper55.1%
 
Boyce43.8%
 
Other1.1%


TransylvaniaCooper40.1%
 
Boyce56.0%
 
Other3.9%


TyrrellCooper73.9%
 
Boyce25.8%
 
Other0.4%


UnionCooper38.8%
 
Boyce60.6%
 
Other0.6%


VanceCooper67.8%
 
Boyce31.0%
 
Other1.2%


WakeCooper52.9%
 
Boyce44.9%
 
Other2.2%


WarrenCooper77.6%
 
Boyce21.5%
 
Other0.9%


WashingtonCooper68.0%
 
Boyce29.5%
 
Other2.5%


WataugaCooper44.4%
 
Boyce50.0%
 
Other5.6%


WayneCooper50.4%
 
Boyce47.6%
 
Other2.0%


WilkesCooper36.4%
 
Boyce60.3%
 
Other3.2%


WilsonCooper62.3%
 
Boyce37.2%
 
Other0.5%


YadkinCooper32.1%
 
Boyce64.5%
 
Other3.5%


YanceyCooper49.1%
 
Boyce48.7%
 
Other2.2%


National DataGraph for 2000 - North Carolina Results for 2000

Login

Terms of Use - DCMA Policy - Privacy Policy and Cookies


© Dave Leip's Atlas of U.S. Elections, LLC 2019 All Rights Reserved