2000 Presidential Democratic Primary Election Data Graphs - California
Note: The Google advertisement links below may advocate political positions that this site does not endorse.
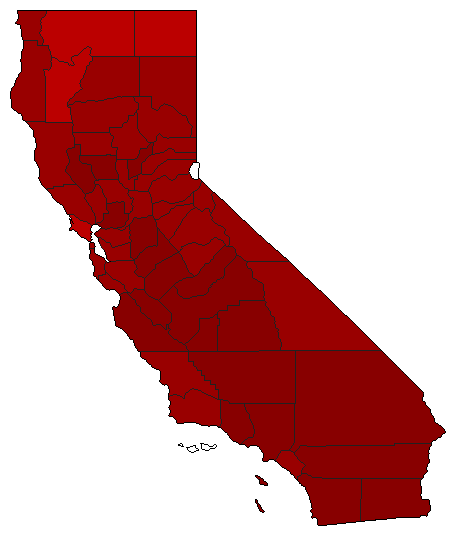
Map

AlamedaGore73.8%
 
00.0%
 
Bradley25.7%
 
Other0.5%


AlpineGore71.3%
 
00.0%
 
Bradley28.7%


AmadorGore78.7%
 
00.0%
 
Bradley20.8%
 
Other0.5%


ButteGore74.1%
 
00.0%
 
Bradley25.3%
 
Other0.6%


CalaverasGore77.2%
 
00.0%
 
Bradley21.9%
 
Other0.9%


ColusaGore80.7%
 
00.0%
 
Bradley17.7%
 
Other1.6%


Contra CostaGore77.1%
 
00.0%
 
Bradley22.6%
 
Other0.3%


Del NorteGore76.8%
 
00.0%
 
Bradley22.4%
 
Other0.8%


El DoradoGore75.6%
 
00.0%
 
Bradley23.7%
 
Other0.6%


FresnoGore84.9%
 
00.0%
 
Bradley14.7%
 
Other0.3%


GlennGore74.3%
 
00.0%
 
Bradley23.2%
 
Other2.4%


HumboldtGore70.9%
 
00.0%
 
Bradley28.8%
 
Other0.3%


ImperialGore88.7%
 
00.0%
 
Bradley9.0%
 
Other2.2%


InyoGore75.1%
 
00.0%
 
Bradley24.1%
 
Other0.8%


KernGore84.5%
 
00.0%
 
Bradley14.4%
 
Other1.1%


KingsGore86.5%
 
00.0%
 
Bradley12.6%
 
Other0.8%


LakeGore82.7%
 
00.0%
 
Bradley16.8%
 
Other0.5%


LassenGore72.4%
 
00.0%
 
Bradley25.9%
 
Other1.7%


Los AngelesGore84.0%
 
00.0%
 
Bradley15.3%
 
Other0.7%


MaderaGore81.2%
 
00.0%
 
Bradley18.1%
 
Other0.7%


MarinGore65.4%
 
00.0%
 
Bradley34.5%
 
Other0.1%


MariposaGore73.8%
 
00.0%
 
Bradley25.5%
 
Other0.6%


MendocinoGore73.2%
 
00.0%
 
Bradley26.2%
 
Other0.6%


MercedGore85.2%
 
00.0%
 
Bradley14.3%
 
Other0.5%


ModocGore67.8%
 
00.0%
 
Bradley31.4%
 
Other0.8%


MonoGore74.6%
 
00.0%
 
Bradley24.4%
 
Other1.0%


MontereyGore80.7%
 
00.0%
 
Bradley18.5%
 
Other0.7%


NapaGore75.0%
 
00.0%
 
Bradley24.3%
 
Other0.7%


NevadaGore72.5%
 
00.0%
 
Bradley27.1%
 
Other0.4%


OrangeGore79.7%
 
00.0%
 
Bradley19.9%
 
Other0.5%


PlacerGore77.4%
 
00.0%
 
Bradley22.2%
 
Other0.5%


PlumasGore70.5%
 
00.0%
 
Bradley28.7%
 
Other0.8%


RiversideGore83.1%
 
00.0%
 
Bradley16.3%
 
Other0.6%


SacramentoGore79.5%
 
00.0%
 
Bradley19.9%
 
Other0.6%


San BenitoGore83.7%
 
00.0%
 
Bradley15.5%
 
Other0.8%


San BernardinoGore83.8%
 
00.0%
 
Bradley14.8%
 
Other1.4%


San DiegoGore82.0%
 
00.0%
 
Bradley17.2%
 
Other0.8%


San FranciscoGore72.3%
 
00.0%
 
Bradley27.6%
 
Other0.1%


San JoaquinGore82.7%
 
00.0%
 
Bradley16.8%
 
Other0.5%


San Luis ObispoGore74.0%
 
00.0%
 
Bradley25.7%
 
Other0.3%


San MateoGore75.3%
 
00.0%
 
Bradley24.5%
 
Other0.2%


Santa BarbaraGore75.1%
 
00.0%
 
Bradley24.7%
 
Other0.2%


Santa ClaraGore75.7%
 
00.0%
 
Bradley23.8%
 
Other0.5%


Santa CruzGore70.3%
 
00.0%
 
Bradley29.3%
 
Other0.4%


ShastaGore73.7%
 
00.0%
 
Bradley25.5%
 
Other0.8%


SierraGore71.4%
 
00.0%
 
Bradley28.2%
 
Other0.5%


SiskiyouGore67.3%
 
00.0%
 
Bradley31.2%
 
Other1.5%


SolanoGore82.3%
 
00.0%
 
Bradley17.0%
 
Other0.7%


SonomaGore74.8%
 
00.0%
 
Bradley24.8%
 
Other0.4%


StanislausGore84.1%
 
00.0%
 
Bradley15.0%
 
Other0.9%


SutterGore79.5%
 
00.0%
 
Bradley19.8%
 
Other0.8%


TehamaGore76.1%
 
00.0%
 
Bradley22.7%
 
Other1.3%


TrinityGore67.1%
 
00.0%
 
Bradley31.8%
 
Other1.1%


TulareGore84.2%
 
00.0%
 
Bradley15.1%
 
Other0.7%


TuolumneGore76.7%
 
00.0%
 
Bradley22.7%
 
Other0.6%


VenturaGore80.2%
 
00.0%
 
Bradley19.6%
 
Other0.2%


YoloGore73.4%
 
00.0%
 
Bradley26.0%
 
Other0.6%


YubaGore80.3%
 
00.0%
 
Bradley18.9%
 
Other0.8%


National DataGraph for 2000 - California Results for 2000

Login

Terms of Use - DCMA Policy - Privacy Policy and Cookies


© Dave Leip's Atlas of U.S. Elections, LLC 2019 All Rights Reserved