2002 Senatorial Democratic Primary Election Data Graphs - West Virginia
Note: The Google advertisement links below may advocate political positions that this site does not endorse.
Data for this Contest was Contributed by on 2014-07-07
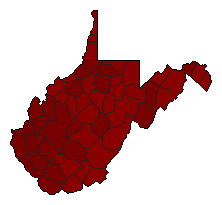
Map

BarbourRockefeller89.1%
 
Barilla4.0%
 
Galloway6.9%


BerkeleyRockefeller88.7%
 
Barilla4.4%
 
Galloway6.9%


BooneRockefeller94.0%
 
Barilla3.3%
 
Galloway2.8%


BraxtonRockefeller90.0%
 
Barilla4.9%
 
Galloway5.1%


BrookeRockefeller79.5%
 
Barilla2.4%
 
Galloway18.0%


CabellRockefeller91.1%
 
Barilla5.2%
 
Galloway3.7%


CalhounRockefeller89.2%
 
Barilla3.6%
 
Galloway7.3%


ClayRockefeller93.2%
 
Barilla4.4%
 
Galloway2.4%


DoddridgeRockefeller88.9%
 
Barilla4.8%
 
Galloway6.4%


FayetteRockefeller90.6%
 
Barilla6.3%
 
Galloway3.1%


GilmerRockefeller87.9%
 
Barilla5.8%
 
Galloway6.3%


GrantRockefeller90.1%
 
Barilla5.7%
 
Galloway4.2%


GreenbrierRockefeller83.9%
 
Barilla13.4%
 
Galloway2.7%


HampshireRockefeller86.3%
 
Barilla7.3%
 
Galloway6.4%


HancockRockefeller81.5%
 
Barilla2.0%
 
Galloway16.6%


HardyRockefeller88.0%
 
Barilla7.3%
 
Galloway4.7%


HarrisonRockefeller91.0%
 
Barilla4.5%
 
Galloway4.5%


JacksonRockefeller92.9%
 
Barilla3.3%
 
Galloway3.8%


JeffersonRockefeller88.6%
 
Barilla5.8%
 
Galloway5.6%


KanawhaRockefeller90.8%
 
Barilla4.9%
 
Galloway4.4%


LewisRockefeller89.9%
 
Barilla5.5%
 
Galloway4.7%


LincolnRockefeller93.6%
 
Barilla3.6%
 
Galloway2.8%


LoganRockefeller93.5%
 
Barilla2.0%
 
Galloway4.4%


McDowellRockefeller94.2%
 
Barilla3.6%
 
Galloway2.2%


MarionRockefeller90.1%
 
Barilla4.5%
 
Galloway5.4%


MarshallRockefeller89.3%
 
Barilla1.6%
 
Galloway9.1%


MasonRockefeller93.3%
 
Barilla3.1%
 
Galloway3.6%


MercerRockefeller87.9%
 
Barilla9.4%
 
Galloway2.7%


MineralRockefeller87.8%
 
Barilla5.5%
 
Galloway6.6%


MingoRockefeller95.1%
 
Barilla2.7%
 
Galloway2.3%


MonongaliaRockefeller86.2%
 
Barilla6.4%
 
Galloway7.4%


MonroeRockefeller88.4%
 
Barilla8.6%
 
Galloway3.0%


MorganRockefeller91.6%
 
Barilla4.8%
 
Galloway3.7%


NicholasRockefeller89.2%
 
Barilla7.4%
 
Galloway3.4%


OhioRockefeller83.3%
 
Barilla2.8%
 
Galloway13.9%


PendletonRockefeller90.3%
 
Barilla5.6%
 
Galloway4.1%


PleasantsRockefeller89.6%
 
Barilla3.3%
 
Galloway7.2%


PocahontasRockefeller87.6%
 
Barilla9.3%
 
Galloway3.2%


PrestonRockefeller86.6%
 
Barilla5.8%
 
Galloway7.6%


PutnamRockefeller90.8%
 
Barilla4.3%
 
Galloway4.9%


RaleighRockefeller89.5%
 
Barilla7.5%
 
Galloway3.0%


RandolphRockefeller87.2%
 
Barilla7.6%
 
Galloway5.2%


RitchieRockefeller91.6%
 
Barilla3.4%
 
Galloway5.0%


RoaneRockefeller93.6%
 
Barilla3.2%
 
Galloway3.2%


SummersRockefeller86.7%
 
Barilla10.8%
 
Galloway2.5%


TaylorRockefeller89.0%
 
Barilla4.4%
 
Galloway6.6%


TuckerRockefeller87.3%
 
Barilla6.7%
 
Galloway6.1%


TylerRockefeller90.7%
 
Barilla2.0%
 
Galloway7.3%


UpshurRockefeller89.0%
 
Barilla5.1%
 
Galloway5.8%


WayneRockefeller91.9%
 
Barilla4.5%
 
Galloway3.6%


WebsterRockefeller93.4%
 
Barilla2.8%
 
Galloway3.7%


WetzelRockefeller90.1%
 
Barilla2.7%
 
Galloway7.1%


WirtRockefeller89.4%
 
Barilla4.3%
 
Galloway6.3%


WoodRockefeller88.9%
 
Barilla4.5%
 
Galloway6.6%


WyomingRockefeller92.7%
 
Barilla4.7%
 
Galloway2.6%


National DataGraph for 2002 - West Virginia Results for 2002

Login

Terms of Use - DCMA Policy - Privacy Policy and Cookies


© Dave Leip's Atlas of U.S. Elections, LLC 2019 All Rights Reserved