2004 Senatorial General Election Data Graphs - North Carolina
Note: The Google advertisement links below may advocate political positions that this site does not endorse.
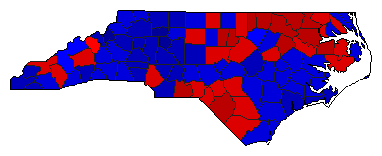
Map

AlamanceBowles41.9%
 
Burr56.8%
 
Other1.3%


AlexanderBowles34.5%
 
Burr64.1%
 
Other1.4%


AlleghanyBowles40.4%
 
Burr58.3%
 
Other1.4%


AnsonBowles62.4%
 
Burr36.6%
 
Other1.0%


AsheBowles39.3%
 
Burr59.3%
 
Other1.5%


AveryBowles26.5%
 
Burr71.3%
 
Other2.2%


BeaufortBowles41.9%
 
Burr56.5%
 
Other1.6%


BertieBowles66.0%
 
Burr33.3%
 
Other0.7%


BladenBowles56.1%
 
Burr42.7%
 
Other1.2%


BrunswickBowles43.2%
 
Burr55.1%
 
Other1.7%


BuncombeBowles51.4%
 
Burr46.5%
 
Other2.1%


BurkeBowles40.9%
 
Burr57.3%
 
Other1.8%


CabarrusBowles36.5%
 
Burr61.7%
 
Other1.8%


CaldwellBowles35.4%
 
Burr62.7%
 
Other1.8%


CamdenBowles42.4%
 
Burr56.0%
 
Other1.7%


CarteretBowles34.9%
 
Burr63.3%
 
Other1.8%


CaswellBowles50.4%
 
Burr48.5%
 
Other1.1%


CatawbaBowles35.4%
 
Burr63.1%
 
Other1.5%


ChathamBowles52.8%
 
Burr45.9%
 
Other1.3%


CherokeeBowles37.6%
 
Burr60.9%
 
Other1.5%


ChowanBowles50.9%
 
Burr47.4%
 
Other1.7%


ClayBowles36.9%
 
Burr61.1%
 
Other2.1%


ClevelandBowles43.9%
 
Burr54.6%
 
Other1.4%


ColumbusBowles56.8%
 
Burr41.8%
 
Other1.4%


CravenBowles41.0%
 
Burr57.4%
 
Other1.6%


CumberlandBowles52.4%
 
Burr46.2%
 
Other1.4%


CurrituckBowles37.8%
 
Burr59.7%
 
Other2.5%


DareBowles44.8%
 
Burr52.7%
 
Other2.5%


DavidsonBowles32.9%
 
Burr65.5%
 
Other1.6%


DavieBowles27.1%
 
Burr71.4%
 
Other1.4%


DuplinBowles46.9%
 
Burr52.0%
 
Other1.2%


DurhamBowles69.5%
 
Burr29.4%
 
Other1.1%


EdgecombeBowles65.5%
 
Burr33.5%
 
Other0.9%


ForsythBowles45.8%
 
Burr53.1%
 
Other1.0%


FranklinBowles48.8%
 
Burr49.8%
 
Other1.4%


GastonBowles35.7%
 
Burr62.6%
 
Other1.7%


GatesBowles57.9%
 
Burr40.7%
 
Other1.3%


GrahamBowles38.3%
 
Burr60.1%
 
Other1.6%


GranvilleBowles53.1%
 
Burr45.7%
 
Other1.2%


GreeneBowles46.9%
 
Burr52.4%
 
Other0.8%


GuilfordBowles53.5%
 
Burr45.3%
 
Other1.2%


HalifaxBowles63.1%
 
Burr36.0%
 
Other0.8%


HarnettBowles41.5%
 
Burr57.2%
 
Other1.4%


HaywoodBowles48.6%
 
Burr49.5%
 
Other1.8%


HendersonBowles37.6%
 
Burr61.1%
 
Other1.3%


HertfordBowles68.0%
 
Burr31.0%
 
Other1.0%


HokeBowles57.5%
 
Burr40.6%
 
Other1.8%


HydeBowles50.7%
 
Burr48.1%
 
Other1.3%


IredellBowles35.8%
 
Burr62.5%
 
Other1.6%


JacksonBowles51.2%
 
Burr47.2%
 
Other1.6%


JohnstonBowles37.1%
 
Burr61.9%
 
Other1.1%


JonesBowles46.1%
 
Burr52.7%
 
Other1.1%


LeeBowles45.9%
 
Burr52.7%
 
Other1.3%


LenoirBowles48.2%
 
Burr51.2%
 
Other0.6%


LincolnBowles36.0%
 
Burr62.2%
 
Other1.9%


McDowellBowles39.1%
 
Burr59.2%
 
Other1.7%


MaconBowles40.8%
 
Burr58.1%
 
Other1.1%


MadisonBowles49.1%
 
Burr49.2%
 
Other1.6%


MartinBowles55.1%
 
Burr44.0%
 
Other0.9%


MecklenburgBowles54.4%
 
Burr44.3%
 
Other1.3%


MitchellBowles28.7%
 
Burr69.4%
 
Other1.8%


MontgomeryBowles46.6%
 
Burr52.0%
 
Other1.4%


MooreBowles39.1%
 
Burr59.9%
 
Other1.0%


NashBowles46.4%
 
Burr52.7%
 
Other0.9%


New HanoverBowles45.8%
 
Burr52.1%
 
Other2.1%


NorthamptonBowles66.9%
 
Burr32.2%
 
Other0.8%


OnslowBowles34.8%
 
Burr63.2%
 
Other2.1%


OrangeBowles67.8%
 
Burr30.9%
 
Other1.3%


PamlicoBowles43.3%
 
Burr55.3%
 
Other1.4%


PasquotankBowles55.9%
 
Burr42.7%
 
Other1.4%


PenderBowles43.9%
 
Burr54.6%
 
Other1.5%


PerquimansBowles46.0%
 
Burr52.7%
 
Other1.3%


PersonBowles44.4%
 
Burr54.4%
 
Other1.2%


PittBowles49.2%
 
Burr50.1%
 
Other0.8%


PolkBowles45.5%
 
Burr52.7%
 
Other1.7%


RandolphBowles29.5%
 
Burr68.9%
 
Other1.5%


RichmondBowles57.2%
 
Burr40.8%
 
Other2.1%


RobesonBowles60.7%
 
Burr37.9%
 
Other1.4%


RockinghamBowles41.5%
 
Burr57.1%
 
Other1.4%


RowanBowles36.0%
 
Burr62.1%
 
Other2.0%


RutherfordBowles40.1%
 
Burr58.4%
 
Other1.5%


SampsonBowles47.5%
 
Burr51.7%
 
Other0.8%


ScotlandBowles58.5%
 
Burr40.4%
 
Other1.1%


StanlyBowles34.4%
 
Burr64.1%
 
Other1.5%


StokesBowles30.9%
 
Burr67.8%
 
Other1.3%


SurryBowles33.9%
 
Burr65.0%
 
Other1.1%


SwainBowles51.6%
 
Burr46.8%
 
Other1.6%


TransylvaniaBowles42.0%
 
Burr56.2%
 
Other1.8%


TyrrellBowles55.7%
 
Burr42.8%
 
Other1.6%


UnionBowles32.7%
 
Burr66.1%
 
Other1.2%


VanceBowles60.6%
 
Burr38.6%
 
Other0.7%


WakeBowles51.4%
 
Burr47.3%
 
Other1.2%


WarrenBowles67.6%
 
Burr31.3%
 
Other1.1%


WashingtonBowles60.1%
 
Burr38.9%
 
Other1.1%


WataugaBowles46.2%
 
Burr51.3%
 
Other2.4%


WayneBowles42.3%
 
Burr56.9%
 
Other0.8%


WilkesBowles32.5%
 
Burr65.9%
 
Other1.6%


WilsonBowles51.5%
 
Burr47.7%
 
Other0.7%


YadkinBowles25.3%
 
Burr73.3%
 
Other1.4%


YanceyBowles49.9%
 
Burr48.6%
 
Other1.4%


National DataGraph for 2004 - North Carolina Results for 2004

Login

Terms of Use - DCMA Policy - Privacy Policy and Cookies


© Dave Leip's Atlas of U.S. Elections, LLC 2019 All Rights Reserved