2010 State Auditor General Election Data Graphs - Ohio
Note: The Google advertisement links below may advocate political positions that this site does not endorse.
Data for this Contest was Contributed by on 2011-02-06
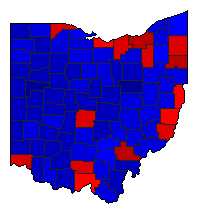
Map

AdamsPepper34.2%
 
Yost60.1%
 
Other5.6%


AllenPepper31.6%
 
Yost63.8%
 
Other4.6%


AshlandPepper29.3%
 
Yost64.5%
 
Other6.2%


AshtabulaPepper46.7%
 
Yost47.1%
 
Other6.2%


AthensPepper62.5%
 
Yost33.3%
 
Other4.2%


AuglaizePepper24.2%
 
Yost70.1%
 
Other5.7%


BelmontPepper48.2%
 
Yost47.6%
 
Other4.2%


BrownPepper35.3%
 
Yost59.0%
 
Other5.8%


ButlerPepper34.3%
 
Yost61.0%
 
Other4.7%


CarrollPepper39.1%
 
Yost54.7%
 
Other6.1%


ChampaignPepper32.7%
 
Yost61.9%
 
Other5.4%


ClarkPepper42.1%
 
Yost53.3%
 
Other4.6%


ClermontPepper29.3%
 
Yost65.2%
 
Other5.5%


ClintonPepper27.0%
 
Yost67.4%
 
Other5.6%


ColumbianaPepper41.5%
 
Yost53.3%
 
Other5.1%


CoshoctonPepper41.8%
 
Yost52.8%
 
Other5.5%


CrawfordPepper34.3%
 
Yost59.8%
 
Other5.8%


CuyahogaPepper62.6%
 
Yost33.5%
 
Other3.9%


DarkePepper27.2%
 
Yost66.9%
 
Other5.9%


DefiancePepper37.0%
 
Yost57.5%
 
Other5.5%


DelawarePepper26.9%
 
Yost68.4%
 
Other4.7%


EriePepper48.6%
 
Yost46.7%
 
Other4.8%


FairfieldPepper33.8%
 
Yost61.0%
 
Other5.3%


FayettePepper31.6%
 
Yost63.5%
 
Other4.9%


FranklinPepper50.1%
 
Yost44.9%
 
Other5.0%


FultonPepper34.9%
 
Yost59.1%
 
Other6.0%


GalliaPepper34.5%
 
Yost60.8%
 
Other4.7%


GeaugaPepper35.0%
 
Yost59.7%
 
Other5.3%


GreenePepper32.8%
 
Yost62.2%
 
Other5.0%


GuernseyPepper41.4%
 
Yost53.7%
 
Other4.9%


HamiltonPepper51.4%
 
Yost45.1%
 
Other3.5%


HancockPepper27.0%
 
Yost68.0%
 
Other5.0%


HardinPepper32.6%
 
Yost60.7%
 
Other6.7%


HarrisonPepper41.9%
 
Yost52.8%
 
Other5.3%


HenryPepper33.7%
 
Yost60.9%
 
Other5.4%


HighlandPepper31.0%
 
Yost62.8%
 
Other6.3%


HockingPepper43.9%
 
Yost48.4%
 
Other7.7%


HolmesPepper22.3%
 
Yost72.3%
 
Other5.4%


HuronPepper36.7%
 
Yost57.1%
 
Other6.2%


JacksonPepper39.8%
 
Yost54.4%
 
Other5.9%


JeffersonPepper47.8%
 
Yost47.6%
 
Other4.6%


KnoxPepper30.8%
 
Yost62.8%
 
Other6.4%


LakePepper42.5%
 
Yost52.1%
 
Other5.4%


LawrencePepper40.6%
 
Yost55.5%
 
Other3.9%


LickingPepper33.8%
 
Yost60.2%
 
Other6.0%


LoganPepper26.7%
 
Yost67.3%
 
Other6.0%


LorainPepper50.4%
 
Yost43.9%
 
Other5.7%


LucasPepper56.9%
 
Yost38.1%
 
Other5.0%


MadisonPepper30.3%
 
Yost64.1%
 
Other5.6%


MahoningPepper61.1%
 
Yost34.9%
 
Other4.1%


MarionPepper38.5%
 
Yost55.9%
 
Other5.6%


MedinaPepper37.1%
 
Yost57.6%
 
Other5.3%


MeigsPepper35.3%
 
Yost60.6%
 
Other4.1%


MercerPepper24.6%
 
Yost69.9%
 
Other5.5%


MiamiPepper27.4%
 
Yost67.2%
 
Other5.4%


MonroePepper53.8%
 
Yost42.1%
 
Other4.1%


MontgomeryPepper45.0%
 
Yost50.8%
 
Other4.2%


MorganPepper39.4%
 
Yost55.4%
 
Other5.2%


MorrowPepper31.1%
 
Yost61.5%
 
Other7.4%


MuskingumPepper38.7%
 
Yost55.9%
 
Other5.4%


NoblePepper40.2%
 
Yost54.2%
 
Other5.6%


OttawaPepper45.9%
 
Yost48.6%
 
Other5.5%


PauldingPepper35.3%
 
Yost58.7%
 
Other6.0%


PerryPepper42.1%
 
Yost51.4%
 
Other6.5%


PickawayPepper34.1%
 
Yost59.8%
 
Other6.1%


PikePepper52.1%
 
Yost43.0%
 
Other4.9%


PortagePepper45.4%
 
Yost49.4%
 
Other5.3%


PreblePepper27.7%
 
Yost66.1%
 
Other6.1%


PutnamPepper26.2%
 
Yost68.9%
 
Other4.9%


RichlandPepper36.3%
 
Yost58.4%
 
Other5.3%


RossPepper44.3%
 
Yost50.0%
 
Other5.7%


SanduskyPepper41.6%
 
Yost52.4%
 
Other6.0%


SciotoPepper48.6%
 
Yost47.6%
 
Other3.8%


SenecaPepper38.1%
 
Yost55.1%
 
Other6.8%


ShelbyPepper26.9%
 
Yost68.0%
 
Other5.1%


StarkPepper43.7%
 
Yost50.3%
 
Other6.0%


SummitPepper51.4%
 
Yost44.4%
 
Other4.2%


TrumbullPepper59.4%
 
Yost35.8%
 
Other4.8%


TuscarawasPepper43.3%
 
Yost51.4%
 
Other5.3%


UnionPepper25.3%
 
Yost68.6%
 
Other6.1%


Van WertPepper24.6%
 
Yost69.9%
 
Other5.5%


VintonPepper45.0%
 
Yost49.3%
 
Other5.8%


WarrenPepper27.3%
 
Yost68.0%
 
Other4.7%


WashingtonPepper38.7%
 
Yost57.4%
 
Other3.9%


WaynePepper33.6%
 
Yost61.2%
 
Other5.3%


WilliamsPepper32.5%
 
Yost62.1%
 
Other5.4%


WoodPepper43.4%
 
Yost50.4%
 
Other6.2%


WyandotPepper31.1%
 
Yost62.5%
 
Other6.4%


National DataGraph for 2010 - Ohio Results for 2010

Login

Terms of Use - DCMA Policy - Privacy Policy and Cookies


© Dave Leip's Atlas of U.S. Elections, LLC 2019 All Rights Reserved