2010 Senatorial General Election Data Graphs - Utah
Note: The Google advertisement links below may advocate political positions that this site does not endorse.
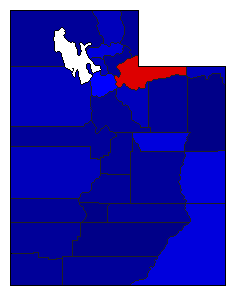
Map

BeaverGranato19.8%
 
Lee72.4%
 
0.0%
 
Other7.8%


Box ElderGranato19.3%
 
Lee72.3%
 
0.0%
 
Other8.4%


CacheGranato21.6%
 
Lee60.5%
 
0.0%
 
Other18.0%


CarbonGranato43.3%
 
Lee50.4%
 
0.0%
 
Other6.3%


DaggettGranato27.5%
 
Lee66.0%
 
0.0%
 
Other6.6%


DavisGranato27.5%
 
Lee67.2%
 
0.0%
 
Other5.3%


DuchesneGranato12.5%
 
Lee79.0%
 
0.0%
 
Other8.5%


EmeryGranato22.6%
 
Lee70.9%
 
0.0%
 
Other6.5%


GarfieldGranato16.0%
 
Lee80.5%
 
0.0%
 
Other3.5%


GrandGranato44.9%
 
Lee50.1%
 
0.0%
 
Other5.0%


IronGranato15.5%
 
Lee76.6%
 
0.0%
 
Other8.0%


JuabGranato20.2%
 
Lee70.5%
 
0.0%
 
Other9.3%


KaneGranato20.3%
 
Lee73.7%
 
0.0%
 
Other6.0%


MillardGranato17.0%
 
Lee69.5%
 
0.0%
 
Other13.5%


MorganGranato19.9%
 
Lee70.3%
 
0.0%
 
Other9.8%


PiuteGranato15.3%
 
Lee80.3%
 
0.0%
 
Other4.4%


RichGranato19.0%
 
Lee77.4%
 
0.0%
 
Other3.6%


Salt LakeGranato47.1%
 
Lee49.0%
 
0.0%
 
Other3.9%


San JuanGranato37.4%
 
Lee58.5%
 
0.0%
 
Other4.0%


SanpeteGranato17.7%
 
Lee72.0%
 
0.0%
 
Other10.2%


SevierGranato14.7%
 
Lee78.8%
 
0.0%
 
Other6.5%


SummitGranato53.2%
 
Lee43.9%
 
0.0%
 
Other2.9%


TooeleGranato31.2%
 
Lee61.0%
 
0.0%
 
Other7.7%


UintahGranato11.4%
 
Lee80.8%
 
0.0%
 
Other7.8%


UtahGranato16.0%
 
Lee78.2%
 
0.0%
 
Other5.8%


WasatchGranato30.6%
 
Lee64.4%
 
0.0%
 
Other5.0%


WashingtonGranato17.2%
 
Lee78.1%
 
0.0%
 
Other4.7%


WayneGranato24.1%
 
Lee72.0%
 
0.0%
 
Other3.9%


WeberGranato35.3%
 
Lee58.4%
 
0.0%
 
Other6.4%


National DataGraph for 2010 - Utah Results for 2010

Login

Terms of Use - DCMA Policy - Privacy Policy and Cookies


© Dave Leip's Atlas of U.S. Elections, LLC 2019 All Rights Reserved