2012 Gubernatorial Democratic Primary Election Data Graphs - Wisconsin
Note: The Google advertisement links below may advocate political positions that this site does not endorse.
Data for this Contest was Contributed by on 2016-12-29
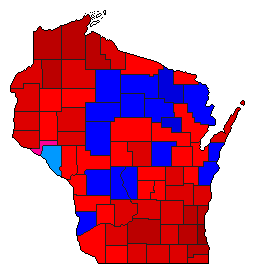
Map

AdamsBarrett42.4%
 
Falk47.4%
 
Other10.2%


AshlandBarrett64.0%
 
Falk25.9%
 
Other10.1%


BarronBarrett46.9%
 
Falk38.1%
 
Other15.0%


BayfieldBarrett64.7%
 
Falk25.5%
 
Other9.9%


BrownBarrett49.2%
 
Falk43.9%
 
Other6.9%


BuffaloBarrett30.9%
 
Falk34.1%
 
Other35.0%


BurnettBarrett57.4%
 
Falk26.5%
 
Other16.1%


CalumetBarrett48.6%
 
Falk43.6%
 
Other7.8%


ChippewaBarrett51.5%
 
Falk35.1%
 
Other13.4%


ClarkBarrett39.0%
 
Falk47.0%
 
Other14.0%


ColumbiaBarrett51.4%
 
Falk39.2%
 
Other9.4%


CrawfordBarrett40.7%
 
Falk46.2%
 
Other13.1%


DaneBarrett61.6%
 
Falk30.5%
 
Other7.9%


DodgeBarrett55.3%
 
Falk38.2%
 
Other6.5%


DoorBarrett50.6%
 
Falk40.2%
 
Other9.2%


DouglasBarrett66.1%
 
Falk25.4%
 
Other8.5%


DunnBarrett48.8%
 
Falk34.4%
 
Other16.9%


Eau ClaireBarrett50.4%
 
Falk31.7%
 
Other17.9%


FlorenceBarrett48.8%
 
Falk41.8%
 
Other9.4%


Fond du LacBarrett52.3%
 
Falk40.1%
 
Other7.6%


ForestBarrett38.3%
 
Falk51.9%
 
Other9.8%


GrantBarrett46.9%
 
Falk44.0%
 
Other9.0%


GreenBarrett53.3%
 
Falk38.2%
 
Other8.5%


Green LakeBarrett48.7%
 
Falk41.9%
 
Other9.4%


IowaBarrett54.4%
 
Falk35.7%
 
Other9.9%


IronBarrett59.1%
 
Falk30.4%
 
Other10.6%


JacksonBarrett40.3%
 
Falk32.5%
 
Other27.2%


JeffersonBarrett55.7%
 
Falk36.1%
 
Other8.2%


JuneauBarrett43.5%
 
Falk47.0%
 
Other9.5%


KenoshaBarrett59.1%
 
Falk34.9%
 
Other6.0%


KewauneeBarrett44.6%
 
Falk45.4%
 
Other10.0%


La CrosseBarrett47.7%
 
Falk40.7%
 
Other11.5%


LafayetteBarrett47.3%
 
Falk43.0%
 
Other9.7%


LangladeBarrett43.5%
 
Falk45.7%
 
Other10.8%


LincolnBarrett41.8%
 
Falk47.5%
 
Other10.7%


ManitowocBarrett45.9%
 
Falk45.9%
 
Other8.2%


MarathonBarrett47.1%
 
Falk43.0%
 
Other10.0%


MarinetteBarrett44.2%
 
Falk47.0%
 
Other8.8%


MarquetteBarrett47.3%
 
Falk42.4%
 
Other10.3%


MenomineeBarrett41.3%
 
Falk52.4%
 
Other6.2%


MilwaukeeBarrett72.1%
 
Falk24.5%
 
Other3.4%


MonroeBarrett37.7%
 
Falk43.2%
 
Other19.1%


OcontoBarrett46.2%
 
Falk45.5%
 
Other8.3%


OneidaBarrett44.6%
 
Falk45.8%
 
Other9.5%


OutagamieBarrett49.5%
 
Falk42.8%
 
Other7.7%


OzaukeeBarrett68.8%
 
Falk26.5%
 
Other4.7%


PepinBarrett33.8%
 
Falk29.8%
 
Other36.4%


PierceBarrett56.3%
 
Falk26.5%
 
Other17.2%


PolkBarrett53.5%
 
Falk27.4%
 
Other19.0%


PortageBarrett55.0%
 
Falk36.2%
 
Other8.8%


PriceBarrett43.0%
 
Falk43.9%
 
Other13.2%


RacineBarrett60.9%
 
Falk33.2%
 
Other5.9%


RichlandBarrett48.2%
 
Falk41.2%
 
Other10.6%


RockBarrett50.1%
 
Falk42.2%
 
Other7.7%


RuskBarrett43.3%
 
Falk42.7%
 
Other13.9%


St. CroixBarrett56.7%
 
Falk28.9%
 
Other14.5%


SaukBarrett52.6%
 
Falk37.2%
 
Other10.2%


SawyerBarrett52.6%
 
Falk30.3%
 
Other17.1%


ShawanoBarrett45.8%
 
Falk45.0%
 
Other9.2%


SheboyganBarrett56.6%
 
Falk38.1%
 
Other5.3%


TaylorBarrett39.6%
 
Falk47.1%
 
Other13.3%


TrempealeauBarrett43.2%
 
Falk35.6%
 
Other21.1%


VernonBarrett46.5%
 
Falk40.8%
 
Other12.7%


VilasBarrett47.5%
 
Falk43.6%
 
Other8.9%


WalworthBarrett59.8%
 
Falk33.4%
 
Other6.9%


WashburnBarrett61.8%
 
Falk27.1%
 
Other11.1%


WashingtonBarrett65.8%
 
Falk29.0%
 
Other5.2%


WaukeshaBarrett67.4%
 
Falk28.2%
 
Other4.4%


WaupacaBarrett45.2%
 
Falk46.1%
 
Other8.7%


WausharaBarrett46.8%
 
Falk45.1%
 
Other8.1%


WinnebagoBarrett51.7%
 
Falk41.6%
 
Other6.8%


WoodBarrett47.8%
 
Falk42.2%
 
Other9.9%


National DataGraph for 2012 - Wisconsin Results for 2012

Login

Terms of Use - DCMA Policy - Privacy Policy and Cookies


© Dave Leip's Atlas of U.S. Elections, LLC 2019 All Rights Reserved