2020 Senatorial General Election Data Graphs - Kansas
Note: The Google advertisement links below may advocate political positions that this site does not endorse.
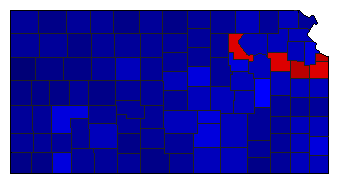
Map

AllenBollier29.0%
 
Marshall65.7%
 
0.0%
 
Other5.3%


AndersonBollier22.5%
 
Marshall70.4%
 
0.0%
 
Other7.2%


AtchisonBollier32.8%
 
Marshall60.0%
 
0.0%
 
Other7.2%


BarberBollier14.1%
 
Marshall80.9%
 
0.0%
 
Other5.0%


BartonBollier22.4%
 
Marshall73.6%
 
0.0%
 
Other4.1%


BourbonBollier25.5%
 
Marshall69.6%
 
0.0%
 
Other4.8%


BrownBollier26.9%
 
Marshall67.1%
 
0.0%
 
Other6.0%


ButlerBollier29.4%
 
Marshall65.7%
 
0.0%
 
Other4.9%


ChaseBollier26.2%
 
Marshall68.9%
 
0.0%
 
Other4.9%


ChautauquaBollier13.9%
 
Marshall82.9%
 
0.0%
 
Other3.3%


CherokeeBollier26.2%
 
Marshall68.6%
 
0.0%
 
Other5.2%


CheyenneBollier16.4%
 
Marshall79.2%
 
0.0%
 
Other4.4%


ClarkBollier15.5%
 
Marshall78.8%
 
0.0%
 
Other5.7%


ClayBollier22.4%
 
Marshall71.9%
 
0.0%
 
Other5.7%


CloudBollier22.4%
 
Marshall71.6%
 
0.0%
 
Other6.0%


CoffeyBollier22.7%
 
Marshall71.2%
 
0.0%
 
Other6.1%


ComancheBollier16.6%
 
Marshall77.9%
 
0.0%
 
Other5.4%


CowleyBollier32.0%
 
Marshall62.2%
 
0.0%
 
Other5.8%


CrawfordBollier39.2%
 
Marshall54.9%
 
0.0%
 
Other5.9%


DecaturBollier15.6%
 
Marshall79.2%
 
0.0%
 
Other5.2%


DickinsonBollier24.1%
 
Marshall70.6%
 
0.0%
 
Other5.3%


DoniphanBollier18.5%
 
Marshall75.8%
 
0.0%
 
Other5.7%


DouglasBollier67.7%
 
Marshall27.9%
 
0.0%
 
Other4.4%


EdwardsBollier18.8%
 
Marshall76.8%
 
0.0%
 
Other4.4%


ElkBollier17.1%
 
Marshall77.3%
 
0.0%
 
Other5.6%


EllisBollier28.3%
 
Marshall67.5%
 
0.0%
 
Other4.1%


EllsworthBollier25.1%
 
Marshall69.9%
 
0.0%
 
Other5.0%


FinneyBollier36.3%
 
Marshall58.2%
 
0.0%
 
Other5.5%


FordBollier33.4%
 
Marshall61.3%
 
0.0%
 
Other5.3%


FranklinBollier29.9%
 
Marshall63.1%
 
0.0%
 
Other7.0%


GearyBollier41.6%
 
Marshall51.2%
 
0.0%
 
Other7.2%


GoveBollier14.4%
 
Marshall82.2%
 
0.0%
 
Other3.4%


GrahamBollier19.3%
 
Marshall76.3%
 
0.0%
 
Other4.4%


GrantBollier21.5%
 
Marshall72.8%
 
0.0%
 
Other5.7%


GrayBollier15.6%
 
Marshall79.4%
 
0.0%
 
Other5.0%


GreeleyBollier15.5%
 
Marshall80.4%
 
0.0%
 
Other4.2%


GreenwoodBollier21.3%
 
Marshall72.3%
 
0.0%
 
Other6.3%


HamiltonBollier18.3%
 
Marshall76.9%
 
0.0%
 
Other4.8%


HarperBollier20.7%
 
Marshall74.6%
 
0.0%
 
Other4.7%


HarveyBollier40.2%
 
Marshall55.3%
 
0.0%
 
Other4.5%


HaskellBollier20.3%
 
Marshall74.7%
 
0.0%
 
Other5.0%


HodgemanBollier17.2%
 
Marshall79.4%
 
0.0%
 
Other3.4%


JacksonBollier30.9%
 
Marshall62.9%
 
0.0%
 
Other6.3%


JeffersonBollier34.2%
 
Marshall60.3%
 
0.0%
 
Other5.5%


JewellBollier14.8%
 
Marshall81.2%
 
0.0%
 
Other4.0%


JohnsonBollier51.6%
 
Marshall43.8%
 
0.0%
 
Other4.6%


KearnyBollier19.4%
 
Marshall77.0%
 
0.0%
 
Other3.6%


KingmanBollier21.5%
 
Marshall73.6%
 
0.0%
 
Other4.9%


KiowaBollier13.5%
 
Marshall80.6%
 
0.0%
 
Other5.9%


LabetteBollier33.0%
 
Marshall62.0%
 
0.0%
 
Other5.0%


LaneBollier15.2%
 
Marshall79.4%
 
0.0%
 
Other5.4%


LeavenworthBollier38.2%
 
Marshall55.2%
 
0.0%
 
Other6.6%


LincolnBollier18.9%
 
Marshall76.9%
 
0.0%
 
Other4.2%


LinnBollier19.9%
 
Marshall73.4%
 
0.0%
 
Other6.7%


LoganBollier15.0%
 
Marshall80.3%
 
0.0%
 
Other4.7%


LyonBollier44.3%
 
Marshall49.9%
 
0.0%
 
Other5.8%


McPhersonBollier30.4%
 
Marshall65.4%
 
0.0%
 
Other4.2%


MarionBollier26.1%
 
Marshall69.6%
 
0.0%
 
Other4.3%


MarshallBollier26.3%
 
Marshall67.9%
 
0.0%
 
Other5.8%


MeadeBollier16.0%
 
Marshall79.4%
 
0.0%
 
Other4.6%


MiamiBollier30.3%
 
Marshall65.0%
 
0.0%
 
Other4.6%


MitchellBollier19.0%
 
Marshall77.4%
 
0.0%
 
Other3.6%


MontgomeryBollier24.3%
 
Marshall70.9%
 
0.0%
 
Other4.8%


MorrisBollier29.0%
 
Marshall66.6%
 
0.0%
 
Other4.4%


MortonBollier14.1%
 
Marshall81.4%
 
0.0%
 
Other4.5%


NemahaBollier18.7%
 
Marshall77.4%
 
0.0%
 
Other3.9%


NeoshoBollier28.4%
 
Marshall67.0%
 
0.0%
 
Other4.6%


NessBollier11.4%
 
Marshall84.8%
 
0.0%
 
Other3.9%


NortonBollier15.8%
 
Marshall79.6%
 
0.0%
 
Other4.6%


OsageBollier28.7%
 
Marshall64.9%
 
0.0%
 
Other6.4%


OsborneBollier17.2%
 
Marshall77.7%
 
0.0%
 
Other5.1%


OttawaBollier17.7%
 
Marshall76.6%
 
0.0%
 
Other5.7%


PawneeBollier25.0%
 
Marshall70.8%
 
0.0%
 
Other4.2%


PhillipsBollier13.4%
 
Marshall81.7%
 
0.0%
 
Other4.9%


PottawatomieBollier26.2%
 
Marshall68.9%
 
0.0%
 
Other4.9%


PrattBollier24.5%
 
Marshall70.9%
 
0.0%
 
Other4.5%


RawlinsBollier15.2%
 
Marshall80.5%
 
0.0%
 
Other4.3%


RenoBollier33.1%
 
Marshall62.2%
 
0.0%
 
Other4.7%


RepublicBollier16.4%
 
Marshall79.4%
 
0.0%
 
Other4.2%


RiceBollier24.4%
 
Marshall70.7%
 
0.0%
 
Other5.0%


RileyBollier50.6%
 
Marshall44.9%
 
0.0%
 
Other4.6%


RooksBollier14.0%
 
Marshall80.0%
 
0.0%
 
Other6.1%


RushBollier18.9%
 
Marshall76.4%
 
0.0%
 
Other4.6%


RussellBollier19.4%
 
Marshall75.7%
 
0.0%
 
Other4.9%


SalineBollier35.4%
 
Marshall60.0%
 
0.0%
 
Other4.6%


ScottBollier13.8%
 
Marshall81.7%
 
0.0%
 
Other4.5%


SedgwickBollier43.3%
 
Marshall52.0%
 
0.0%
 
Other4.7%


SewardBollier35.1%
 
Marshall59.9%
 
0.0%
 
Other5.0%


ShawneeBollier50.5%
 
Marshall44.3%
 
0.0%
 
Other5.3%


SheridanBollier12.1%
 
Marshall85.2%
 
0.0%
 
Other2.8%


ShermanBollier15.5%
 
Marshall78.8%
 
0.0%
 
Other5.7%


SmithBollier17.2%
 
Marshall78.6%
 
0.0%
 
Other4.1%


StaffordBollier18.8%
 
Marshall77.0%
 
0.0%
 
Other4.2%


StantonBollier18.3%
 
Marshall78.4%
 
0.0%
 
Other3.3%


StevensBollier13.5%
 
Marshall81.8%
 
0.0%
 
Other4.8%


SumnerBollier26.0%
 
Marshall68.3%
 
0.0%
 
Other5.7%


ThomasBollier18.1%
 
Marshall78.0%
 
0.0%
 
Other3.8%


TregoBollier18.3%
 
Marshall76.6%
 
0.0%
 
Other5.1%


WabaunseeBollier26.6%
 
Marshall68.7%
 
0.0%
 
Other4.7%


WallaceBollier6.6%
 
Marshall90.2%
 
0.0%
 
Other3.2%


WashingtonBollier17.6%
 
Marshall78.5%
 
0.0%
 
Other3.9%


WichitaBollier16.0%
 
Marshall80.5%
 
0.0%
 
Other3.4%


WilsonBollier21.6%
 
Marshall73.6%
 
0.0%
 
Other4.8%


WoodsonBollier22.9%
 
Marshall71.0%
 
0.0%
 
Other6.1%


WyandotteBollier63.5%
 
Marshall29.9%
 
0.0%
 
Other6.6%


National DataGraph for 2020 - Kansas Results for 2020

Login

Terms of Use - DCMA Policy - Privacy Policy and Cookies


© Dave Leip's Atlas of U.S. Elections, LLC 2019 All Rights Reserved