2022 Senatorial General Election Data Graphs - South Carolina
Note: The Google advertisement links below may advocate political positions that this site does not endorse.
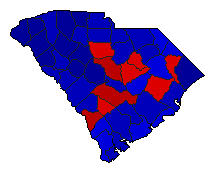
Map

AbbevilleMatthews26.9%
 
Scott73.0%
 
0.0%
 
Other0.0%


AikenMatthews31.4%
 
Scott68.5%
 
0.0%
 
Other0.1%


AllendaleMatthews67.7%
 
Scott32.3%
 
0.0%


AndersonMatthews22.7%
 
Scott77.1%
 
0.0%
 
Other0.1%


BambergMatthews54.1%
 
Scott45.9%
 
0.0%


BarnwellMatthews39.2%
 
Scott60.8%
 
0.0%
 
Other0.1%


BeaufortMatthews36.9%
 
Scott63.1%
 
0.0%
 
Other0.1%


BerkeleyMatthews37.4%
 
Scott62.5%
 
0.0%
 
Other0.1%


CalhounMatthews38.6%
 
Scott61.3%
 
0.0%
 
Other0.2%


CharlestonMatthews47.4%
 
Scott52.4%
 
0.0%
 
Other0.2%


CherokeeMatthews20.8%
 
Scott79.1%
 
0.0%
 
Other0.1%


ChesterMatthews37.8%
 
Scott62.2%
 
0.0%
 
Other0.0%


ChesterfieldMatthews33.8%
 
Scott66.2%
 
0.0%
 
Other0.0%


ClarendonMatthews42.0%
 
Scott57.9%
 
0.0%
 
Other0.1%


ColletonMatthews38.0%
 
Scott61.9%
 
0.0%
 
Other0.1%


DarlingtonMatthews39.4%
 
Scott60.5%
 
0.0%
 
Other0.1%


DillonMatthews43.4%
 
Scott56.5%
 
0.0%
 
Other0.1%


DorchesterMatthews37.7%
 
Scott62.2%
 
0.0%
 
Other0.1%


EdgefieldMatthews30.5%
 
Scott69.4%
 
0.0%
 
Other0.1%


FairfieldMatthews53.3%
 
Scott46.6%
 
0.0%
 
Other0.1%


FlorenceMatthews41.6%
 
Scott58.4%
 
0.0%
 
Other0.1%


GeorgetownMatthews36.1%
 
Scott63.8%
 
0.0%
 
Other0.1%


GreenvilleMatthews33.3%
 
Scott66.5%
 
0.0%
 
Other0.2%


GreenwoodMatthews30.9%
 
Scott69.1%
 
0.0%
 
Other0.1%


HamptonMatthews49.8%
 
Scott50.2%
 
0.0%
 
Other0.0%


HorryMatthews27.2%
 
Scott72.8%
 
0.0%
 
Other0.0%


JasperMatthews40.9%
 
Scott59.1%
 
0.0%
 
Other0.0%


KershawMatthews33.0%
 
Scott66.9%
 
0.0%
 
Other0.1%


LancasterMatthews32.8%
 
Scott67.2%
 
0.0%
 
Other0.1%


LaurensMatthews26.4%
 
Scott73.4%
 
0.0%
 
Other0.2%


LeeMatthews57.8%
 
Scott42.2%
 
0.0%
 
Other0.1%


LexingtonMatthews29.1%
 
Scott70.7%
 
0.0%
 
Other0.1%


McCormickMatthews38.3%
 
Scott61.7%
 
0.0%


MarionMatthews52.8%
 
Scott47.2%
 
0.0%
 
Other0.0%


MarlboroMatthews48.9%
 
Scott51.0%
 
0.0%
 
Other0.1%


NewberryMatthews29.6%
 
Scott70.3%
 
0.0%
 
Other0.1%


OconeeMatthews20.7%
 
Scott79.3%
 
0.0%
 
Other0.1%


OrangeburgMatthews61.6%
 
Scott38.4%
 
0.0%
 
Other0.1%


PickensMatthews20.0%
 
Scott79.9%
 
0.0%
 
Other0.1%


RichlandMatthews62.6%
 
Scott37.2%
 
0.0%
 
Other0.2%


SaludaMatthews24.5%
 
Scott75.4%
 
0.0%
 
Other0.0%


SpartanburgMatthews29.6%
 
Scott70.3%
 
0.0%
 
Other0.1%


SumterMatthews50.5%
 
Scott49.4%
 
0.0%
 
Other0.1%


UnionMatthews30.6%
 
Scott69.3%
 
0.0%
 
Other0.0%


WilliamsburgMatthews58.4%
 
Scott41.5%
 
0.0%
 
Other0.0%


YorkMatthews35.9%
 
Scott64.0%
 
0.0%
 
Other0.1%


National DataGraph for 2022 - South Carolina Results for 2022

Login

Terms of Use - DCMA Policy - Privacy Policy and Cookies


© Dave Leip's Atlas of U.S. Elections, LLC 2019 All Rights Reserved